Spoilt for Choice
Selected factors influencing the poll numbers of German parties
Bastien Chevallier & Johannes Frohnmeyer
“If the federal election were held next Sunday, which of the following parties would you vote for?”
(“Sonntagsfrage”)
Dataset 1
2017 – Jan 2026
Number of surveys: 3,700
Source: dawum.de
About ⅓ of the surveys are for state or European elections, and the data only starts in 2017.
Dataset 2
2002 – Jan 2026
Number of polls: 5,079 (Bundestag)
Source: wahlrecht.de
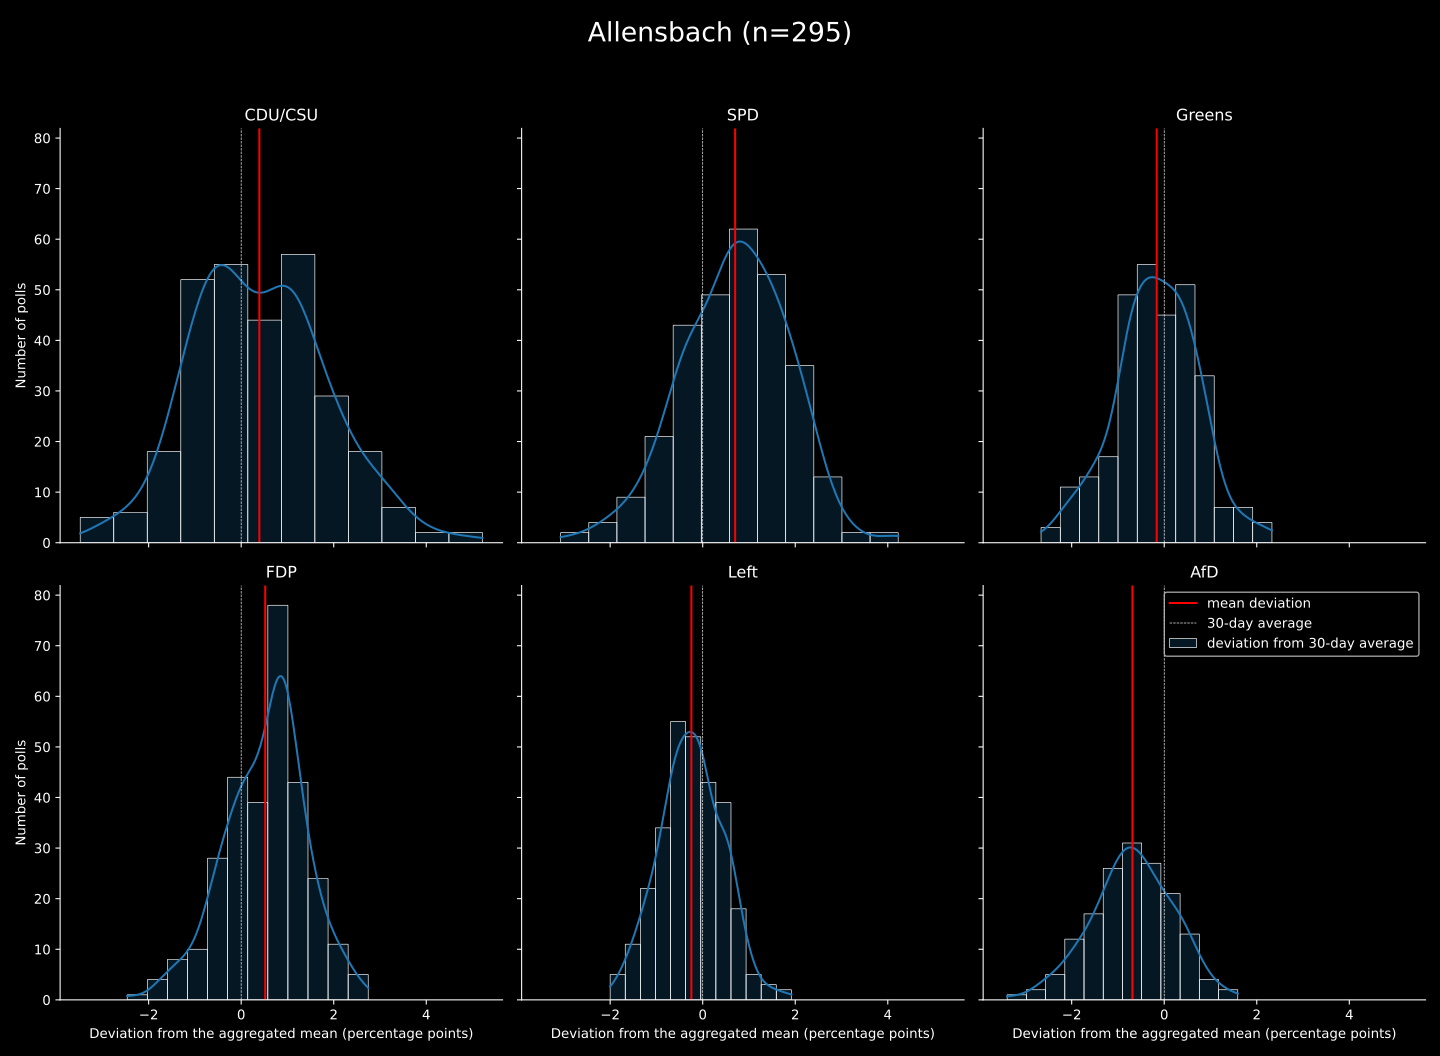
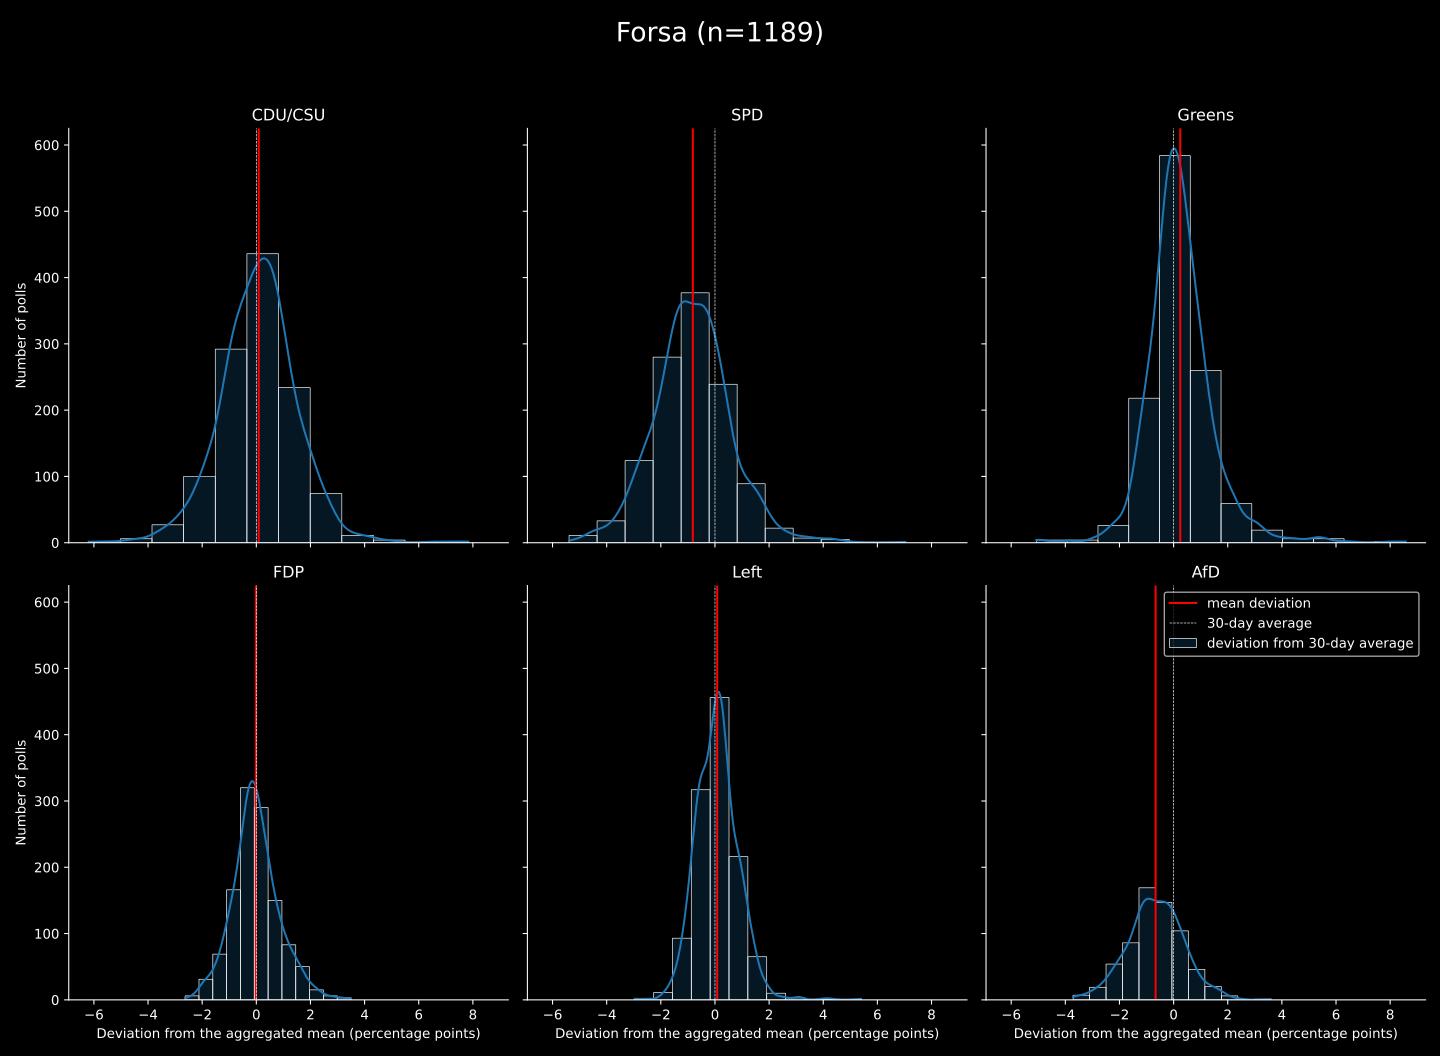
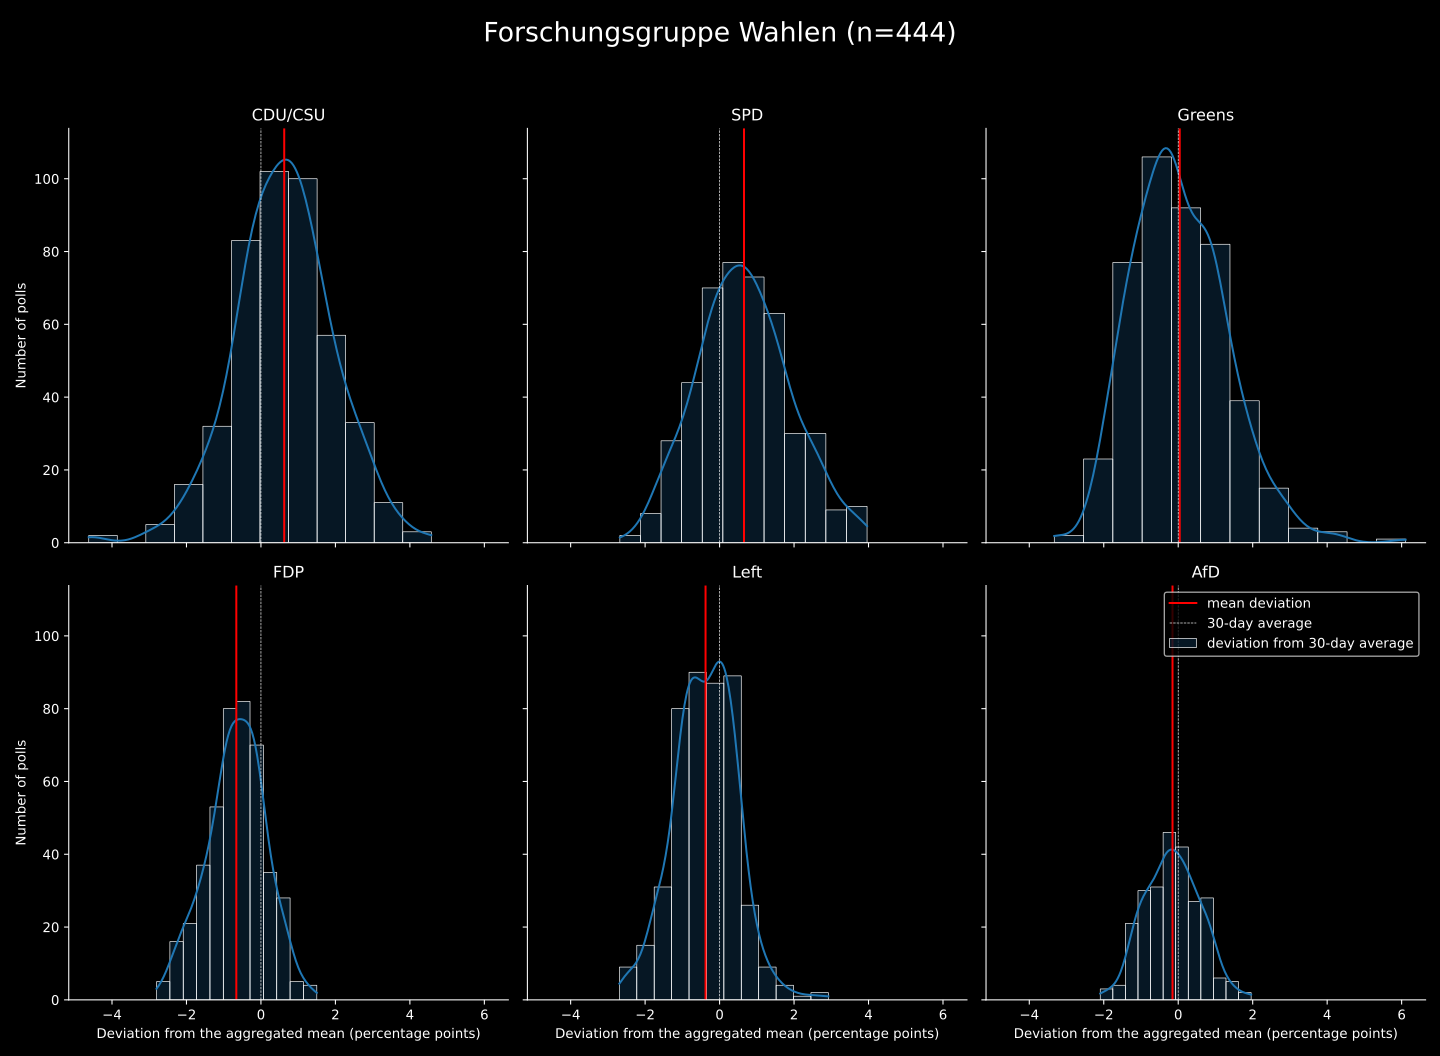
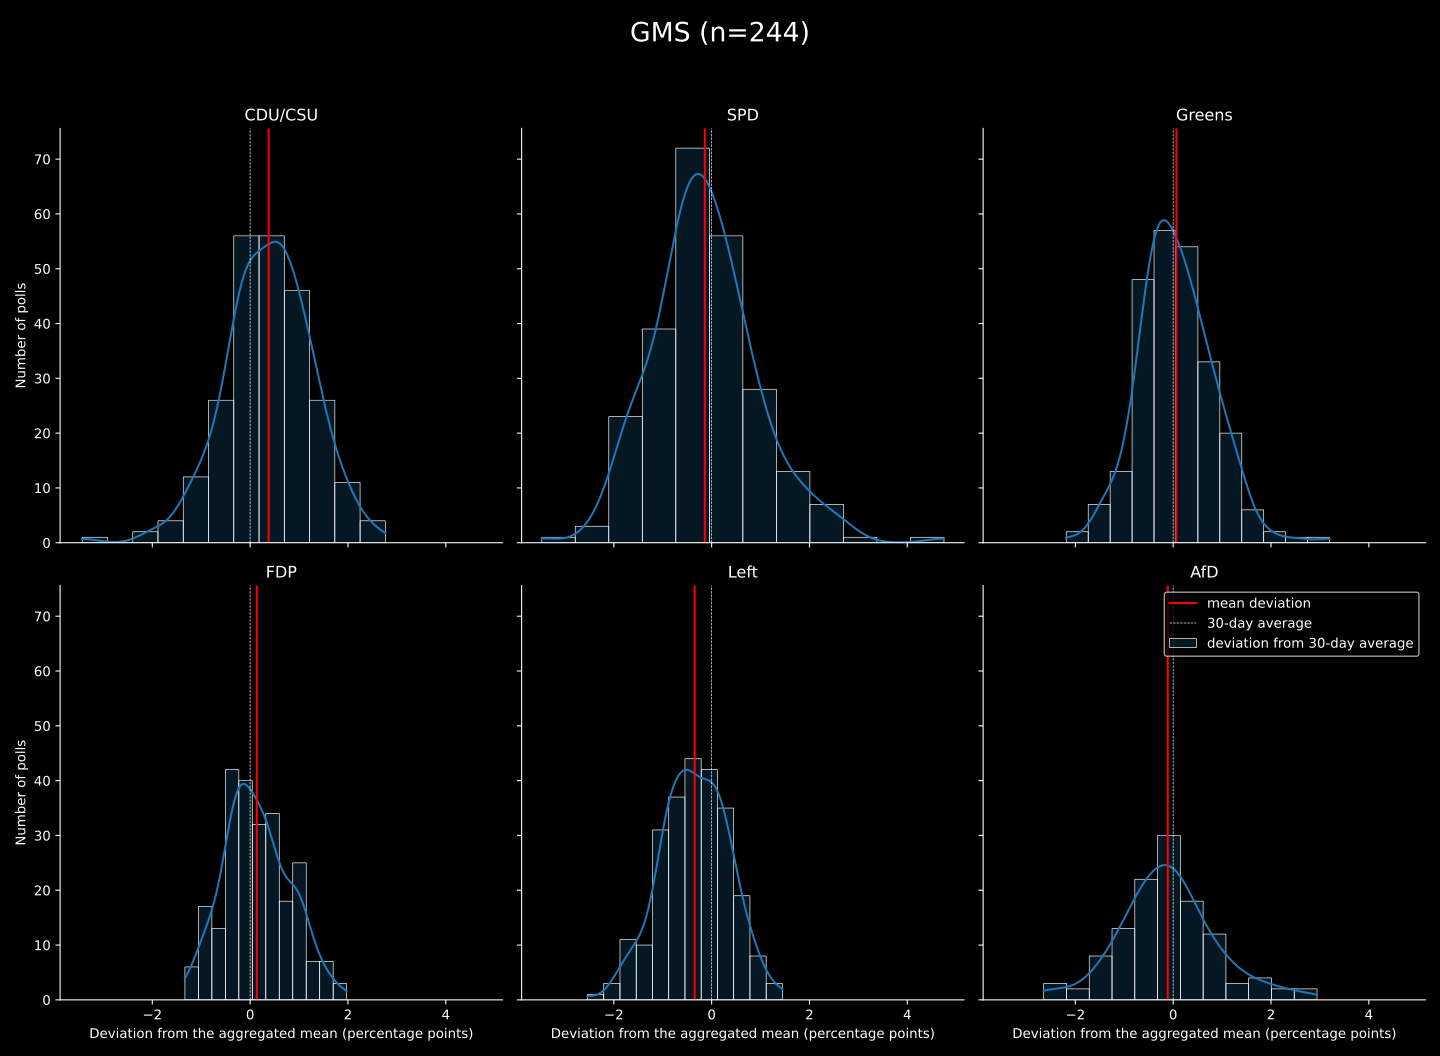
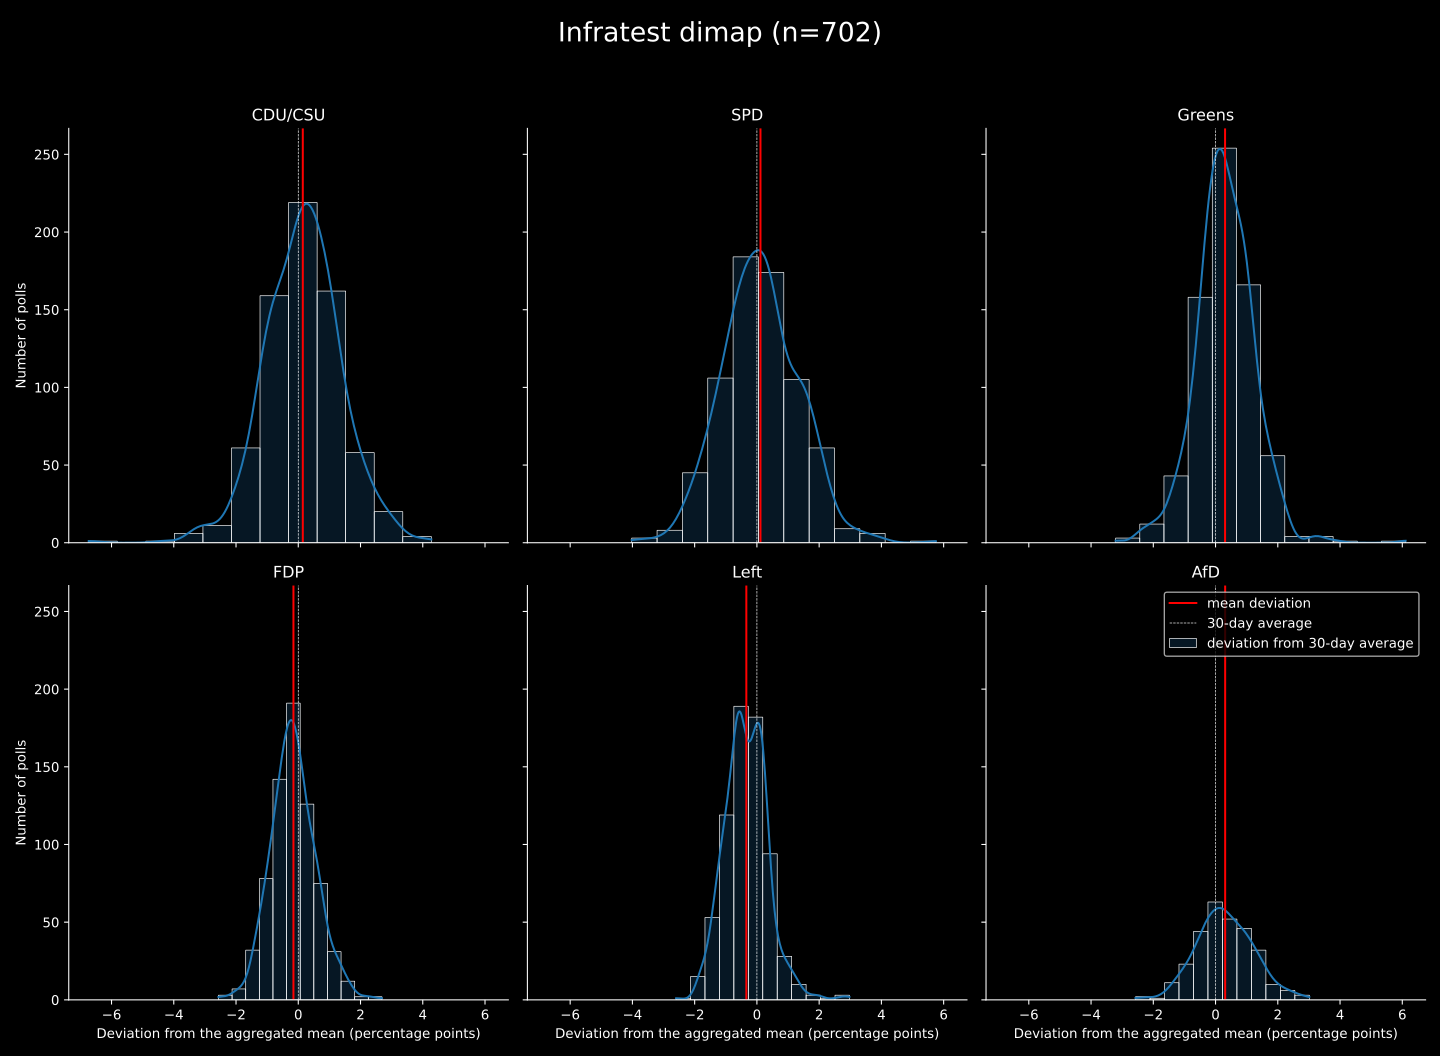
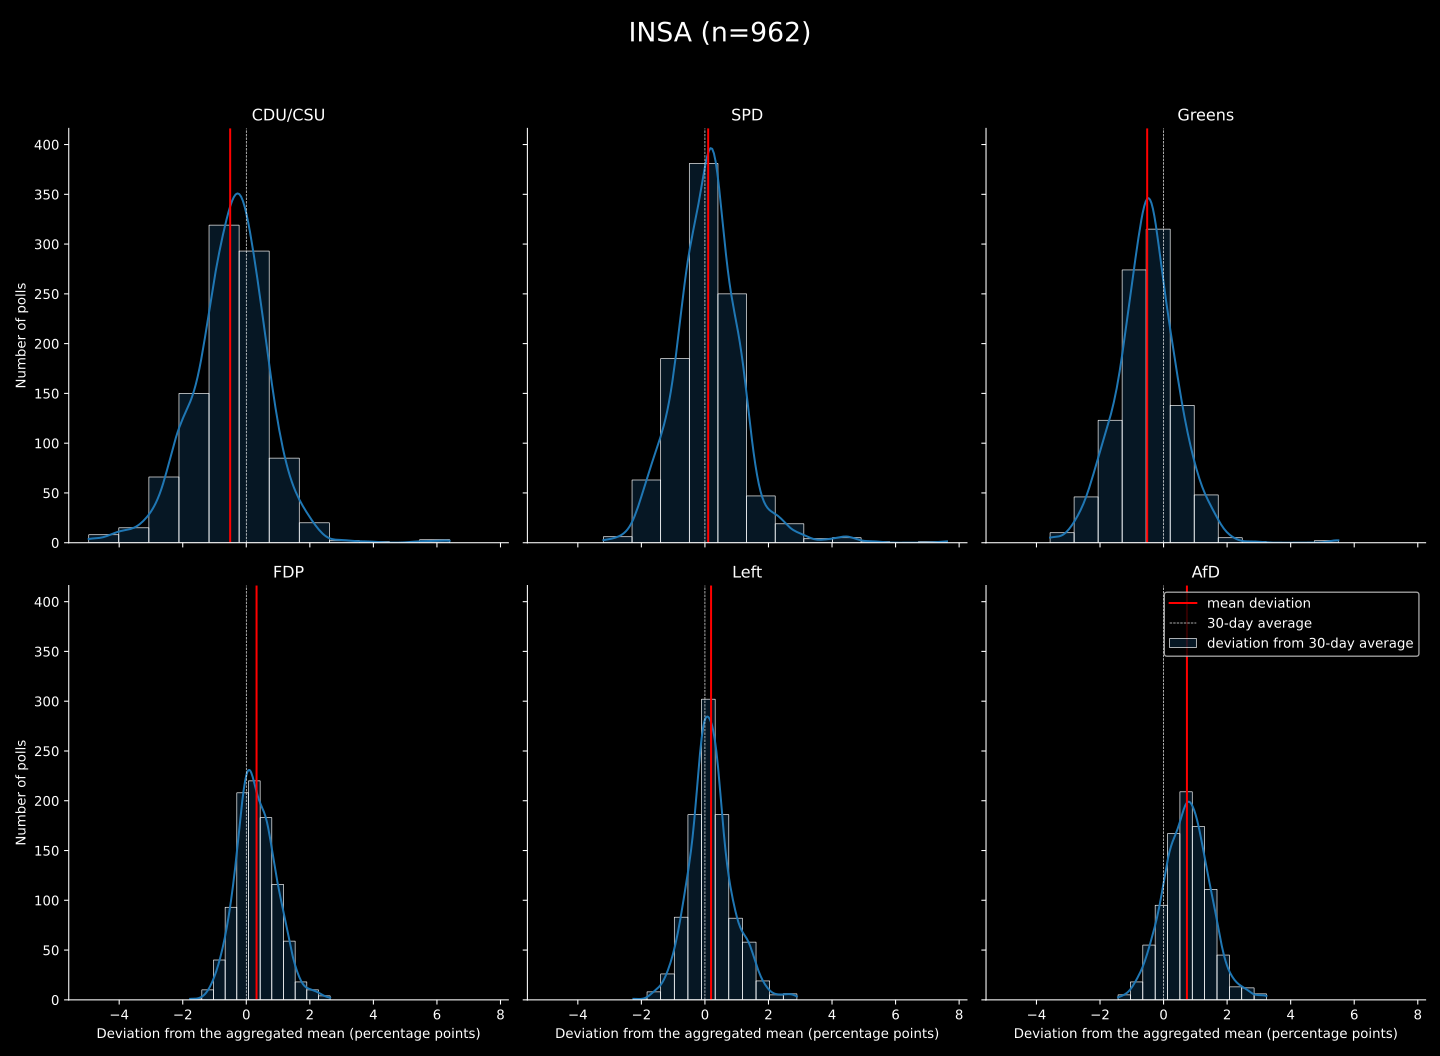
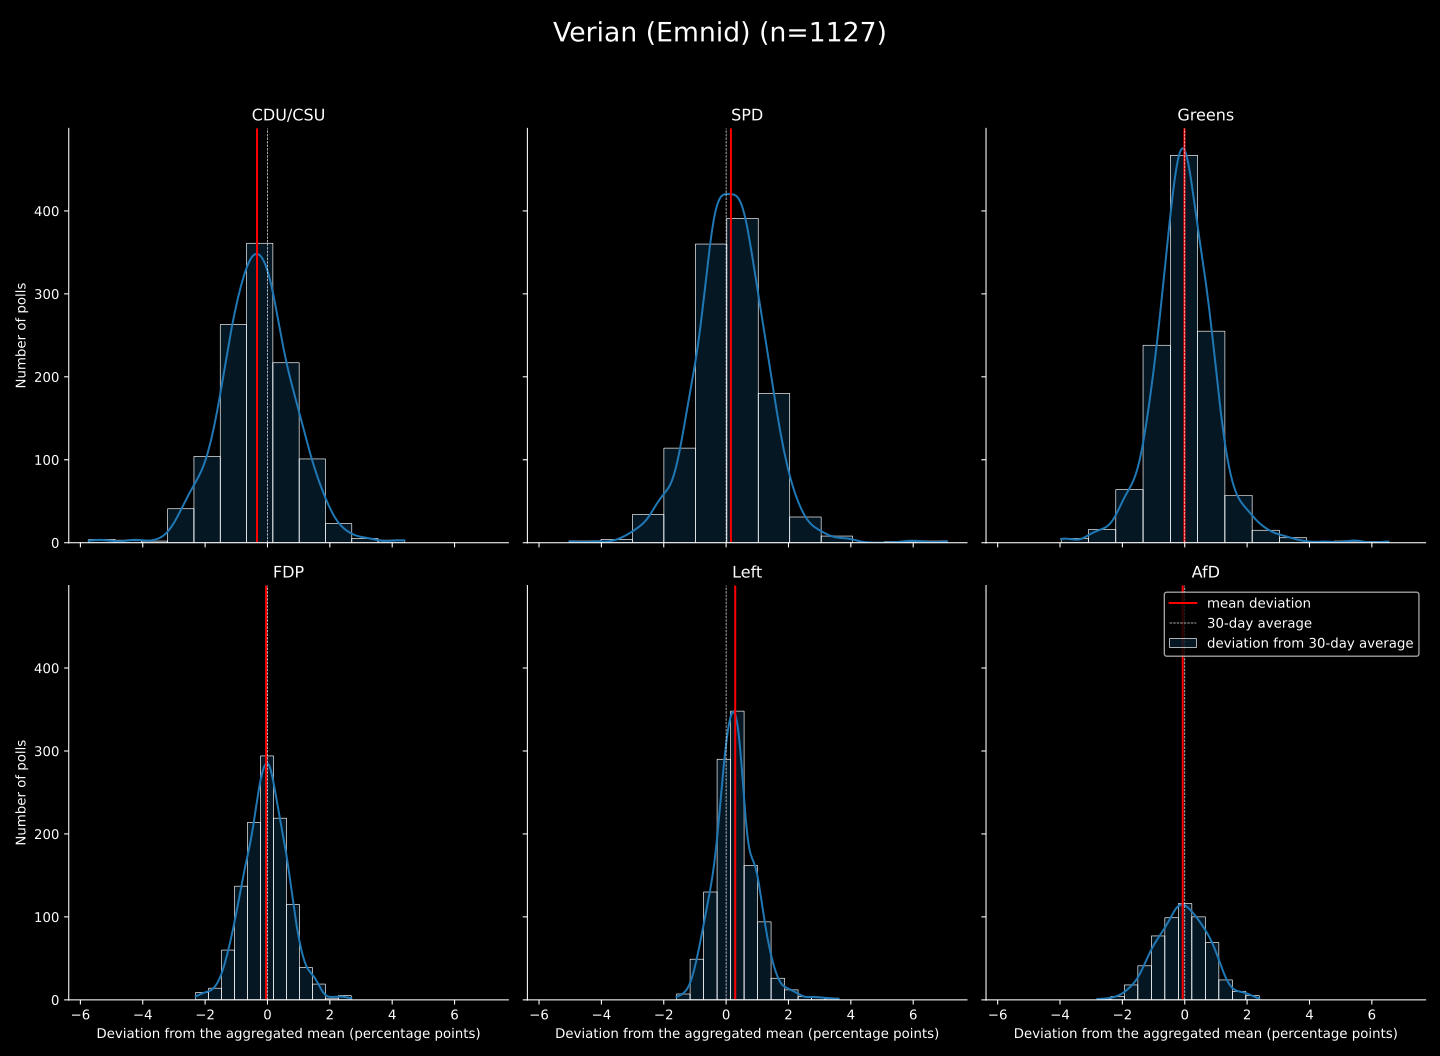
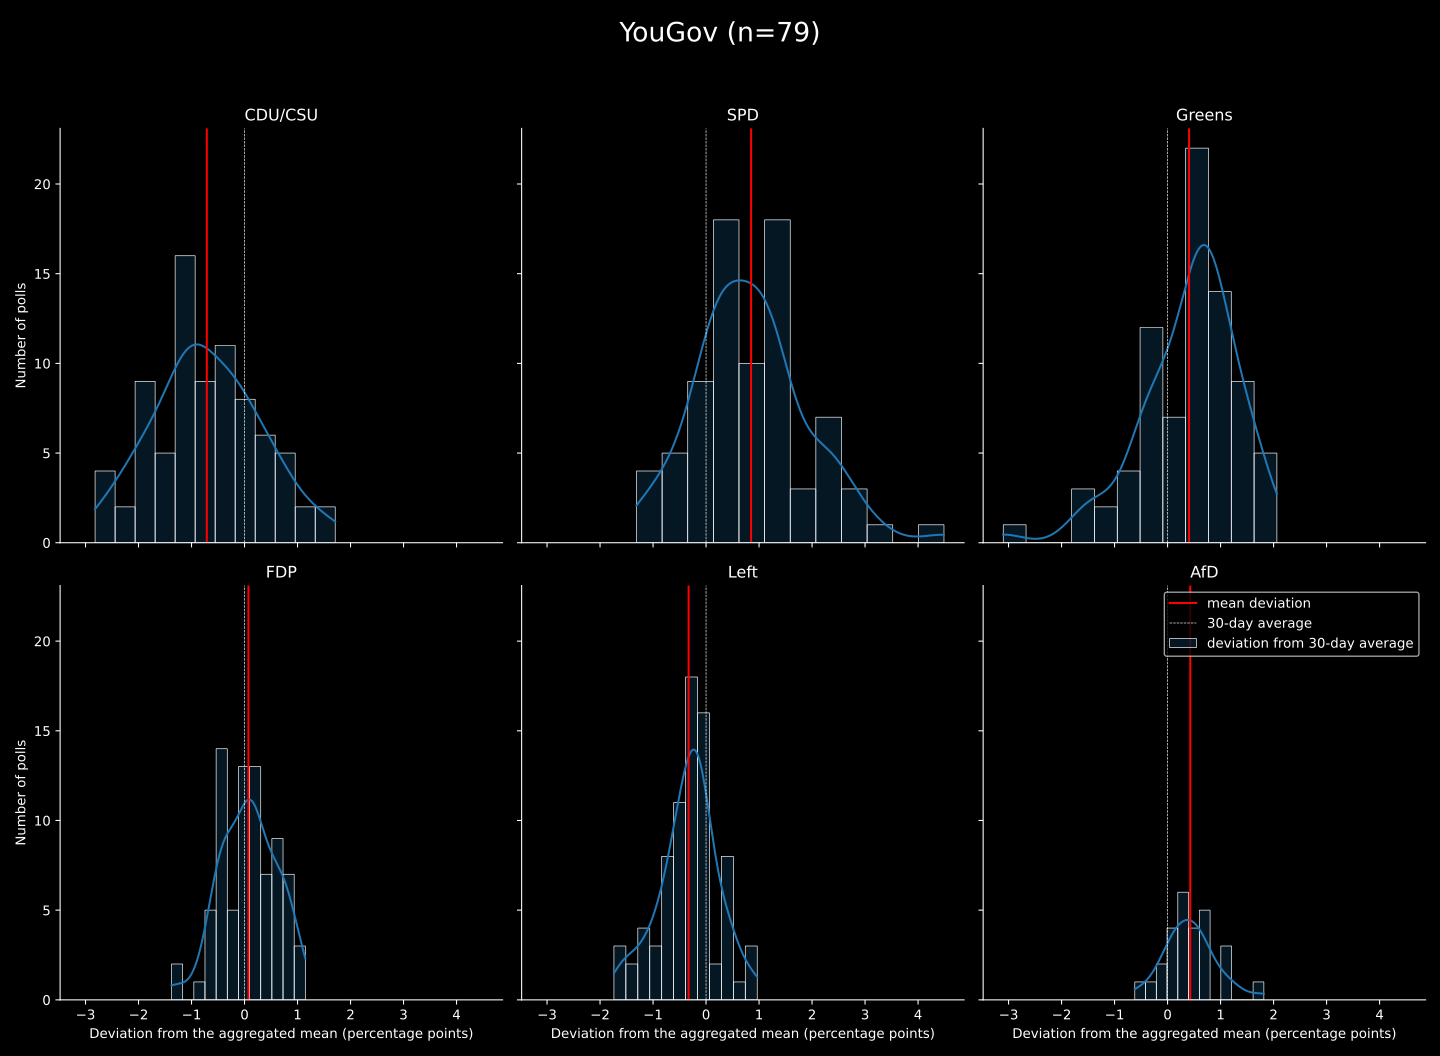
Do institutes differ?
Deviation of each institute’s polls from the 30-day average of all polls.
A mean away from zero hints at a “house effect”.
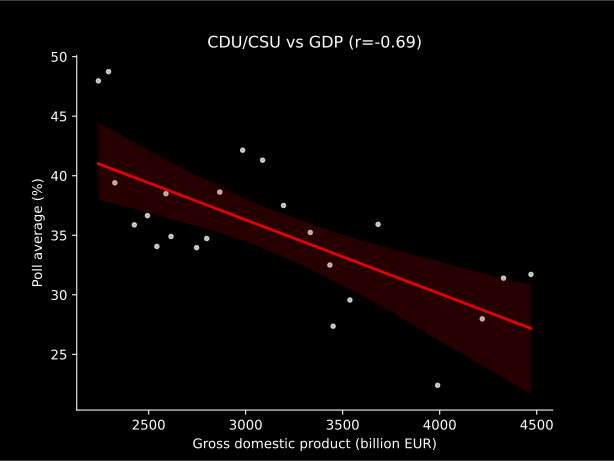
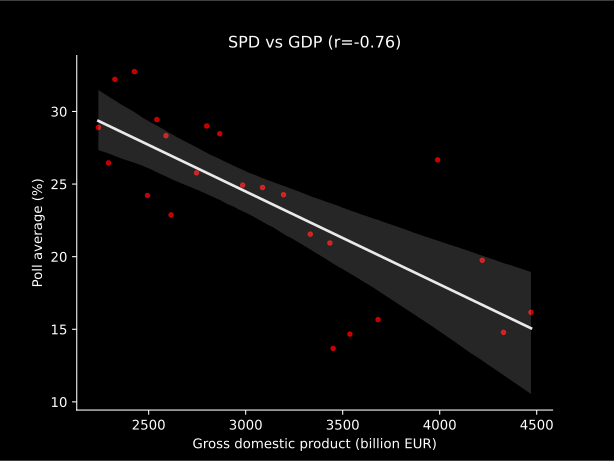
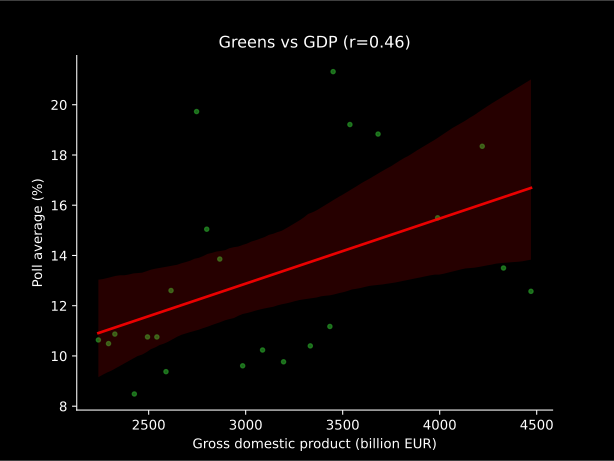
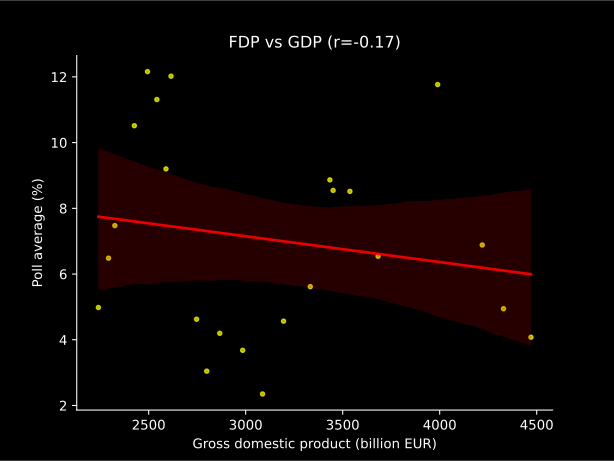
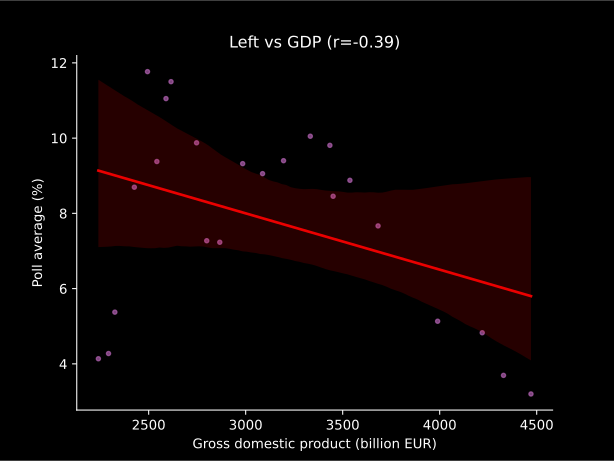
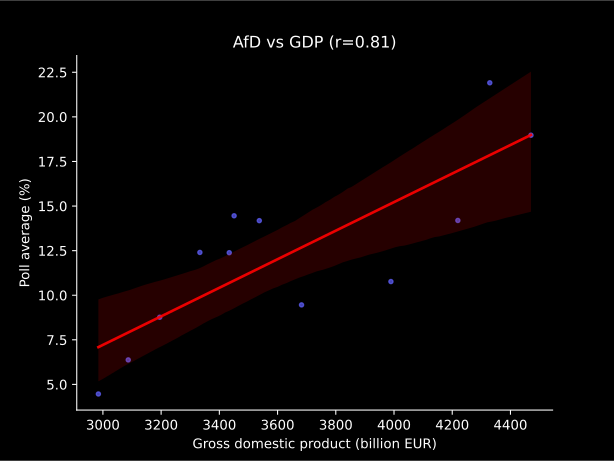
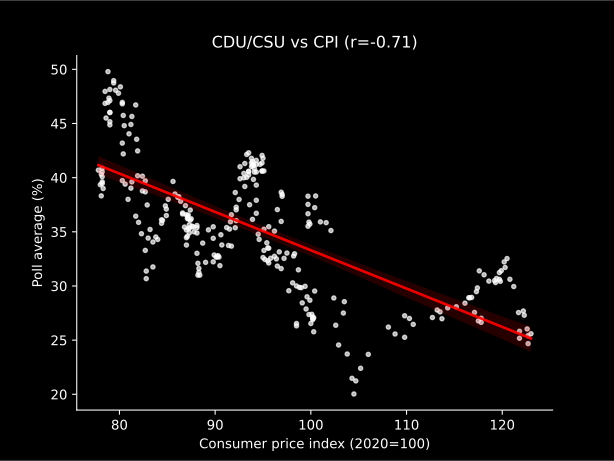
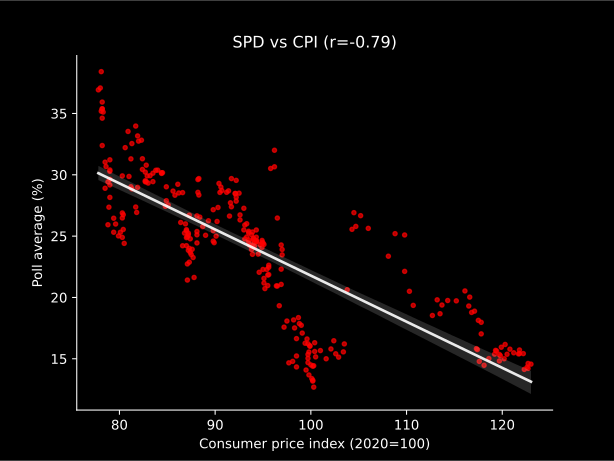
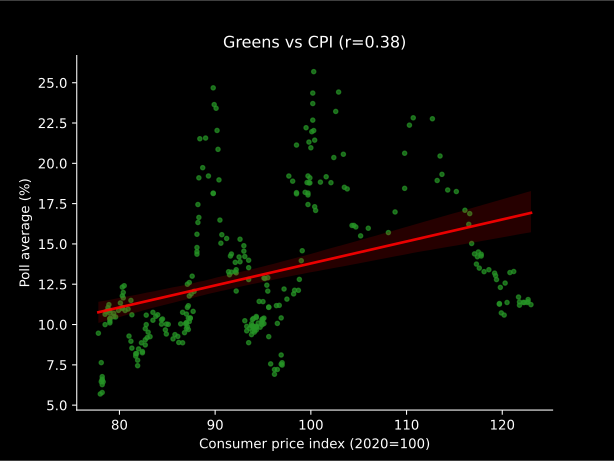
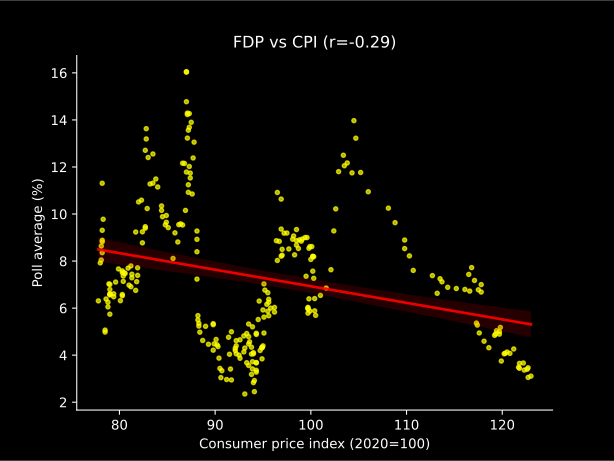
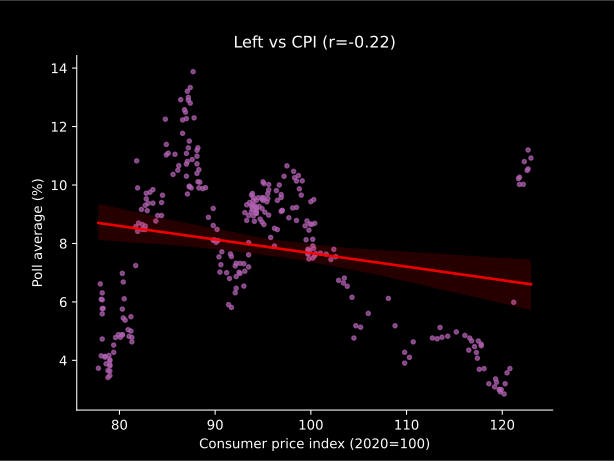
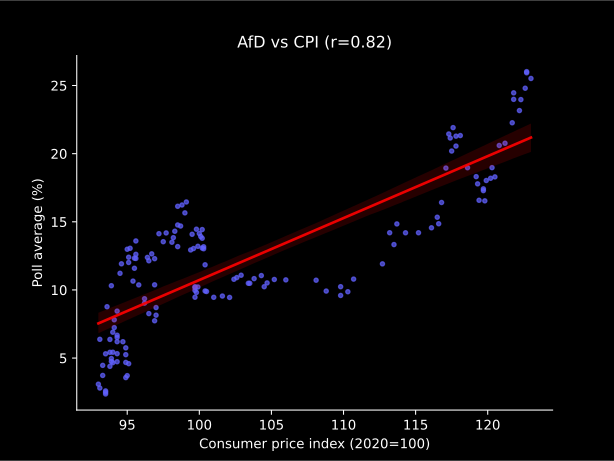
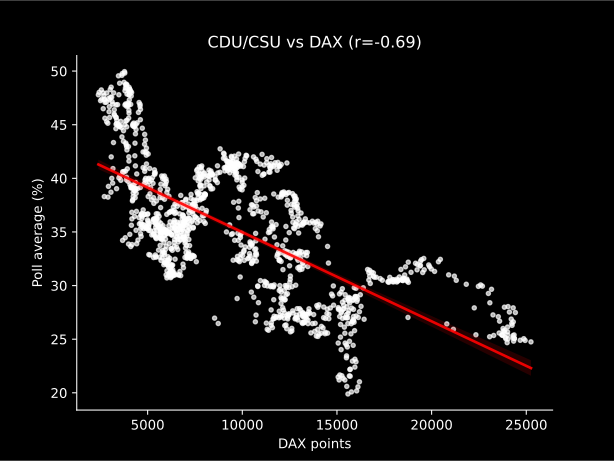
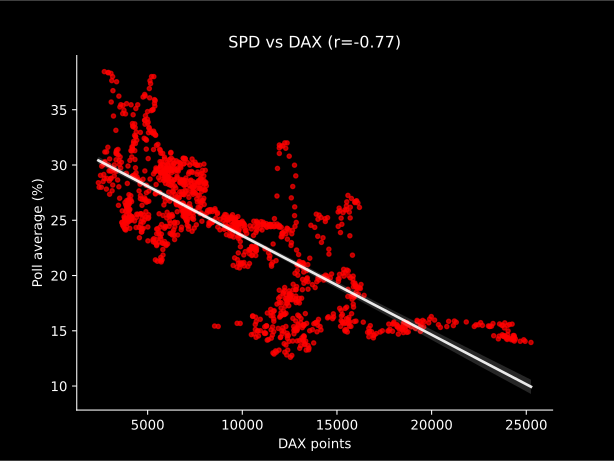
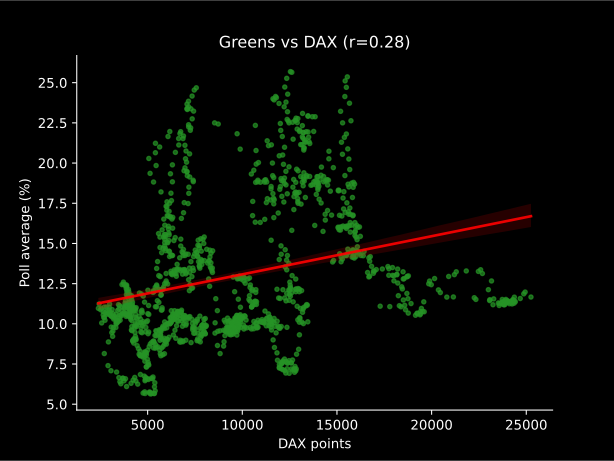
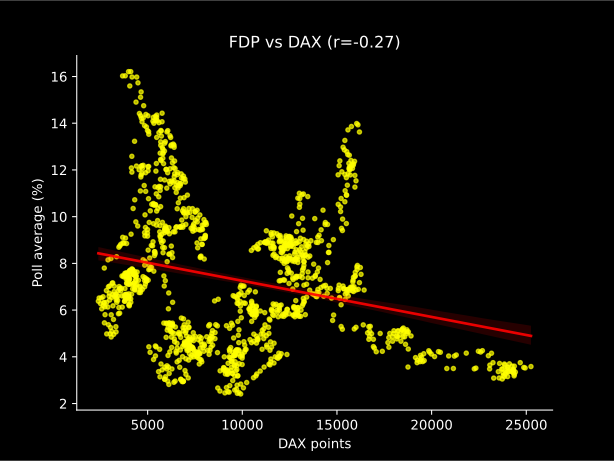
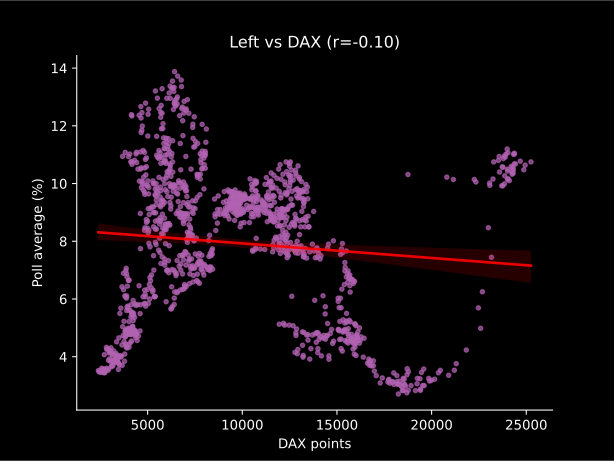
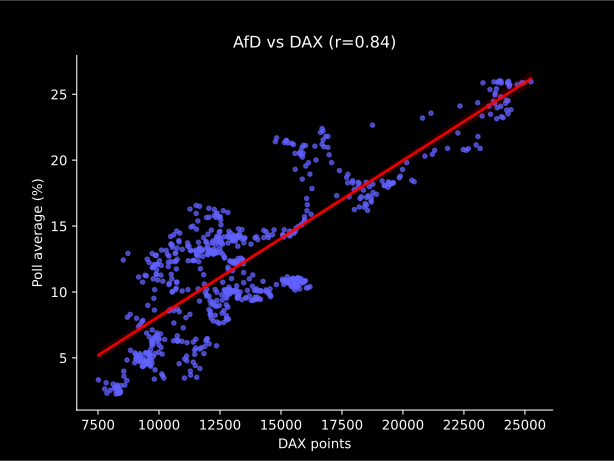
Poll average vs. economy
Pearson r with the 30-day poll average; click a value for its scatter plot.
Both series trend over time, so this is not evidence of causation.
Dataset 3
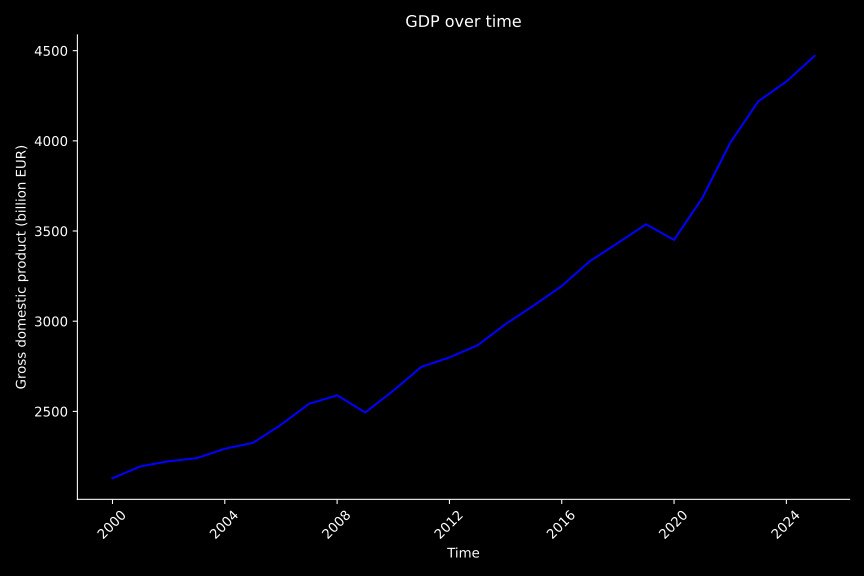
2000 – 2025
yearly gross domestic product (n=26)
Source: destatis.de
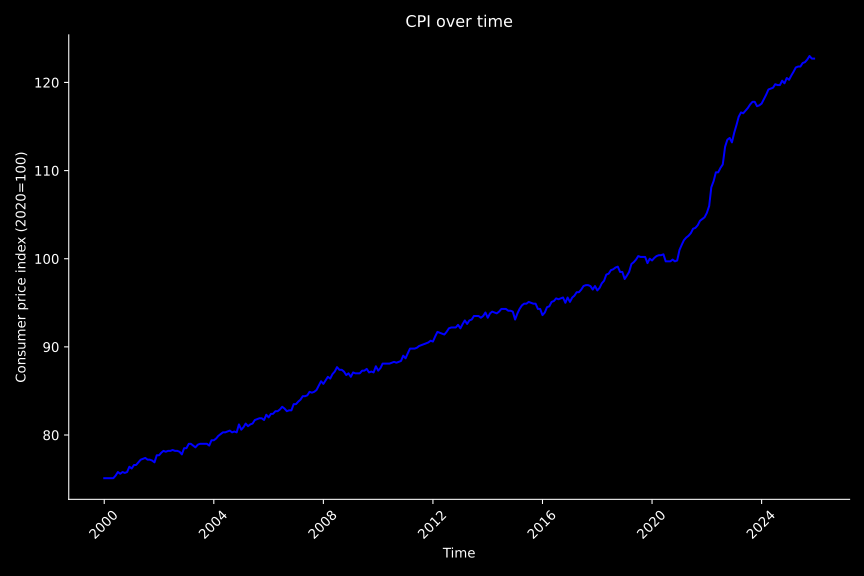
Dataset 4
2000 – Dec 2025
monthly consumer price index (n=312)
Source: destatis.de
Dataset 5
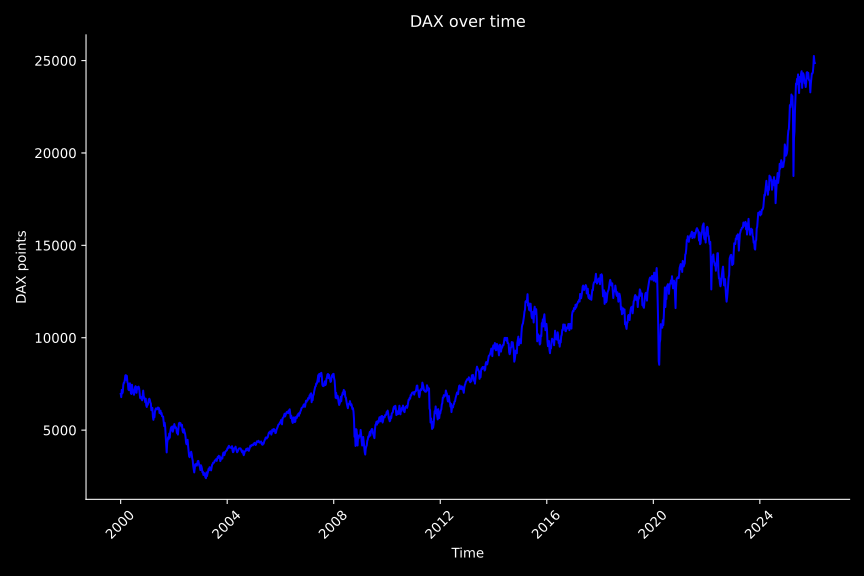
2000 – Jan 2026
weekly DAX opening value (n=1,361)
Source: investing.com
Inspiration
dkriesel.com