You have four minutes.

RUN!

37 runners.

27 cyclists (twice each).
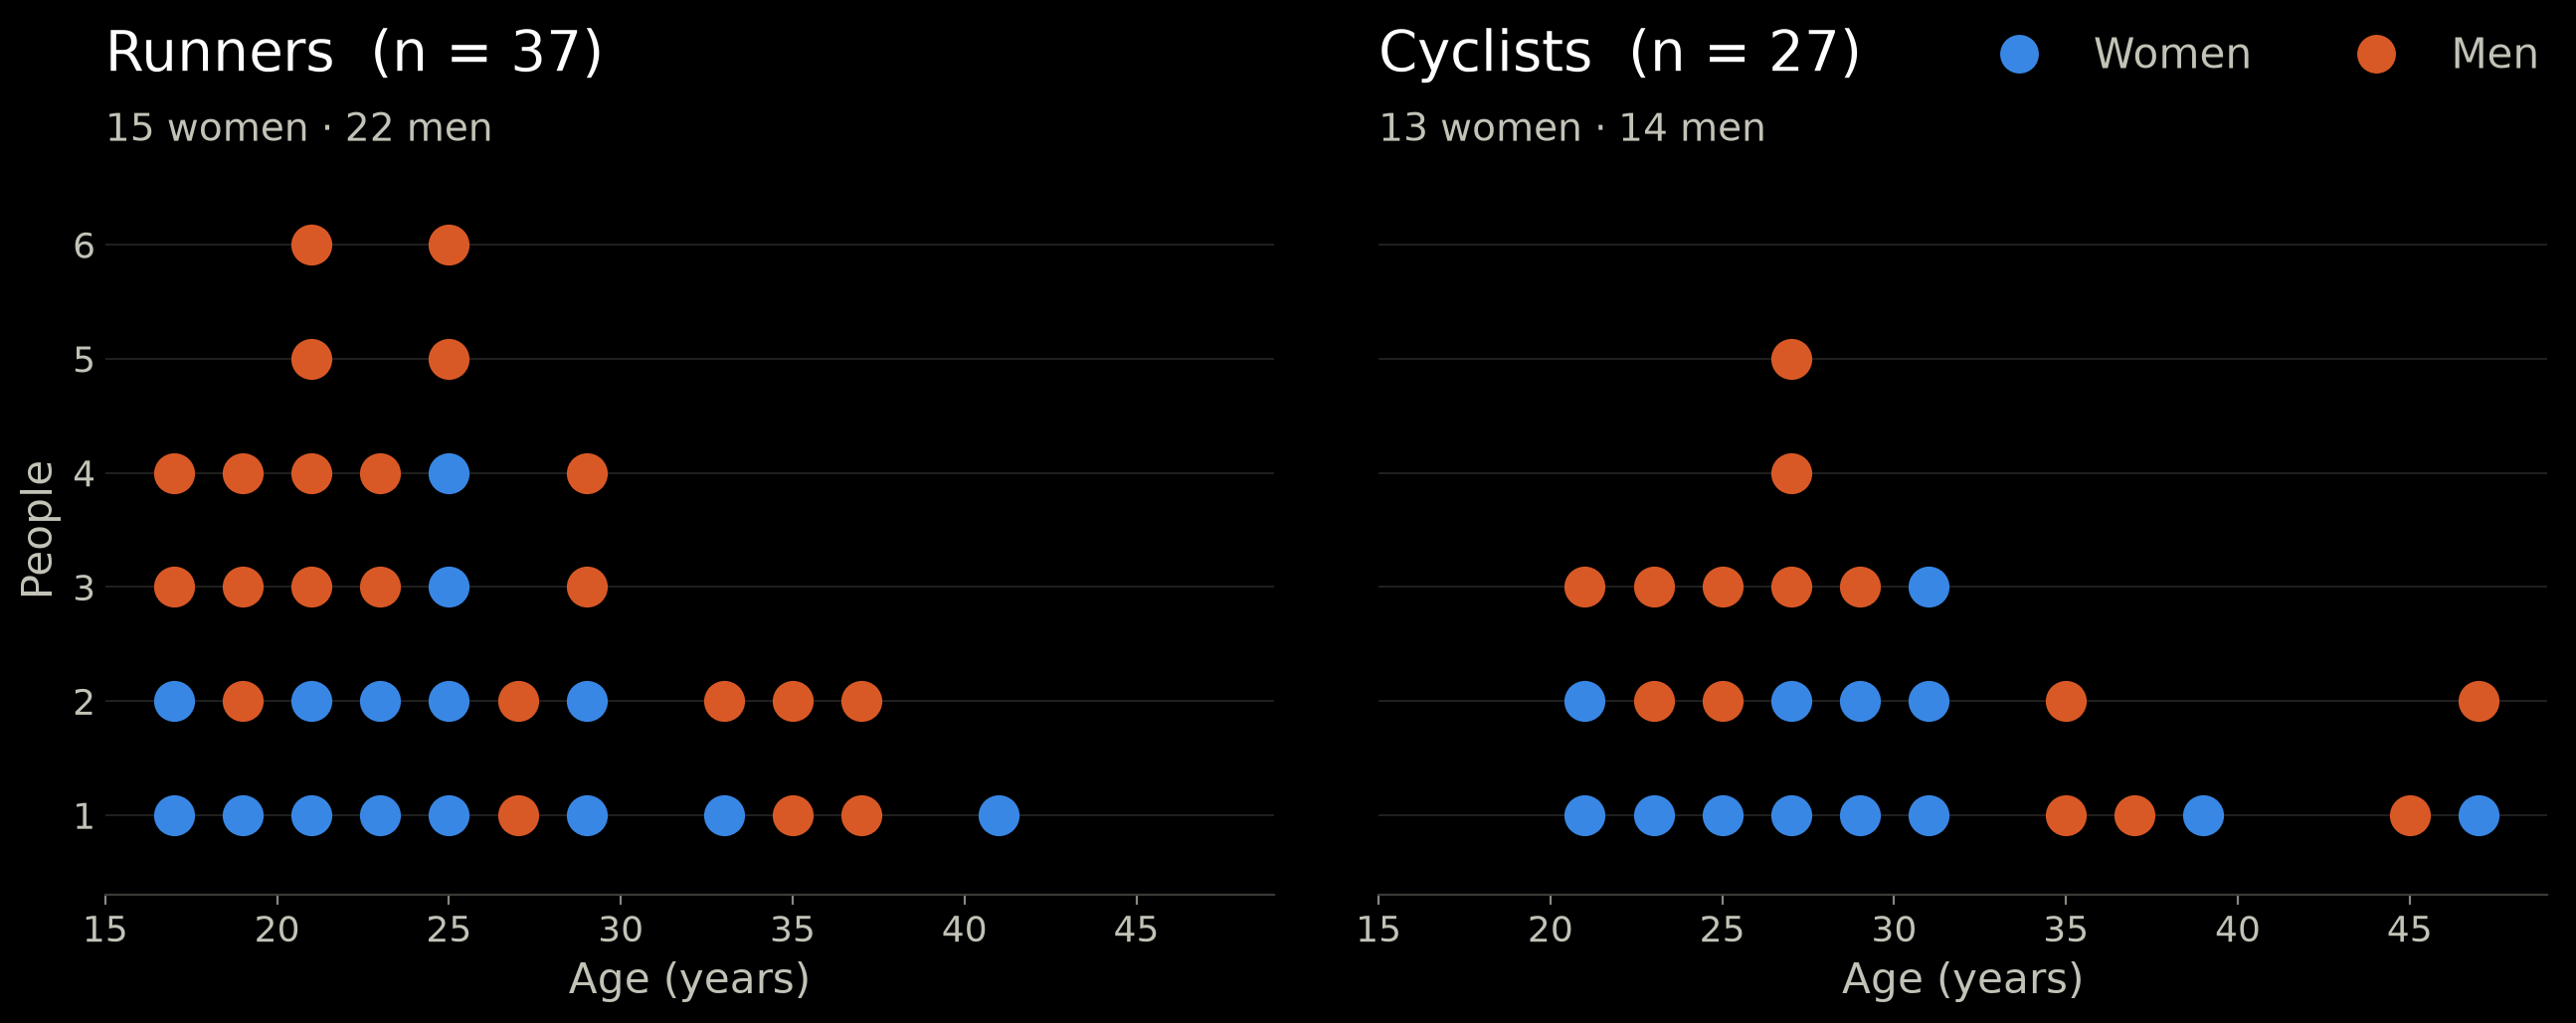
Dot histogram of age, one dot per person, women and men coloured: 37 runners (15 women, 22 men, median age 24, 16-40) and 27 cyclists (13 women, 14 men, median age 28, 20-47)

How was the data supposed to look?

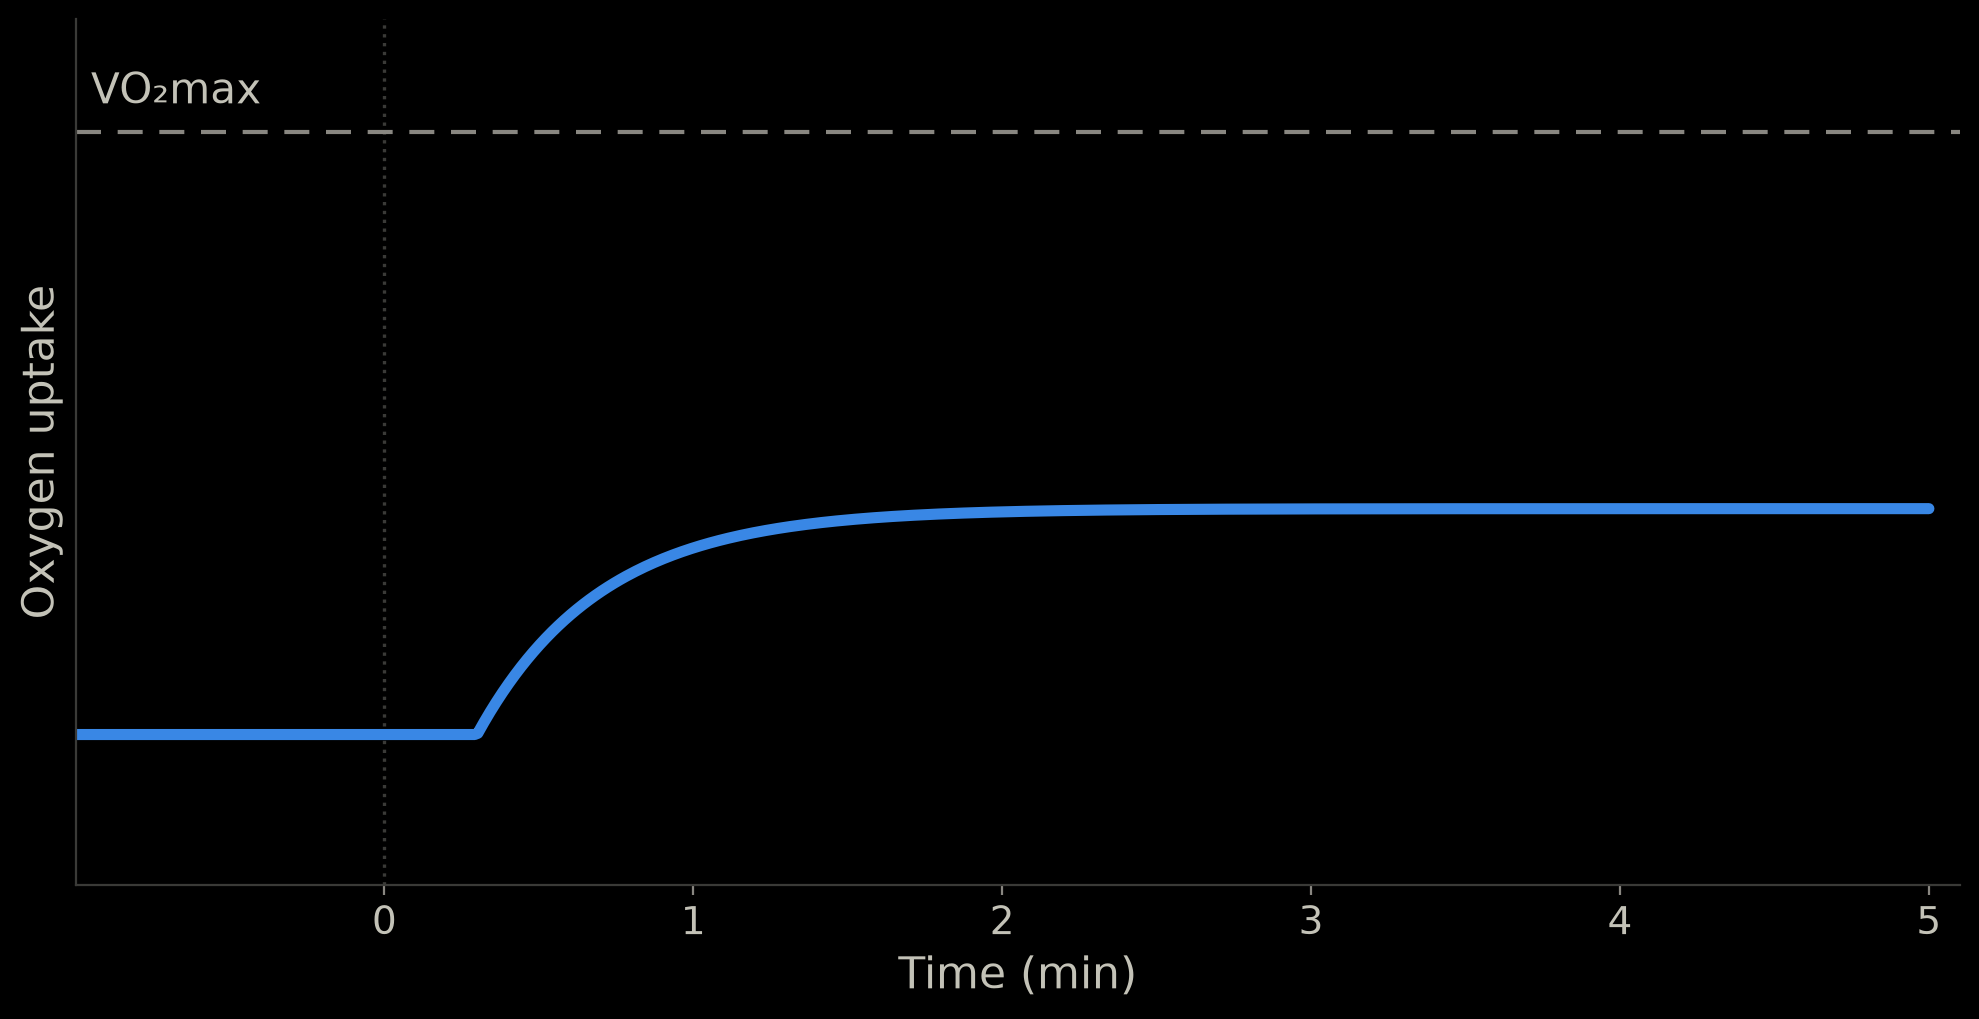
Empty graph: oxygen uptake against time in minutes Schematic: oxygen uptake rises after exercise starts and levels off within about two minutes, well below VO2max

Moderate

How was the data supposed to look?
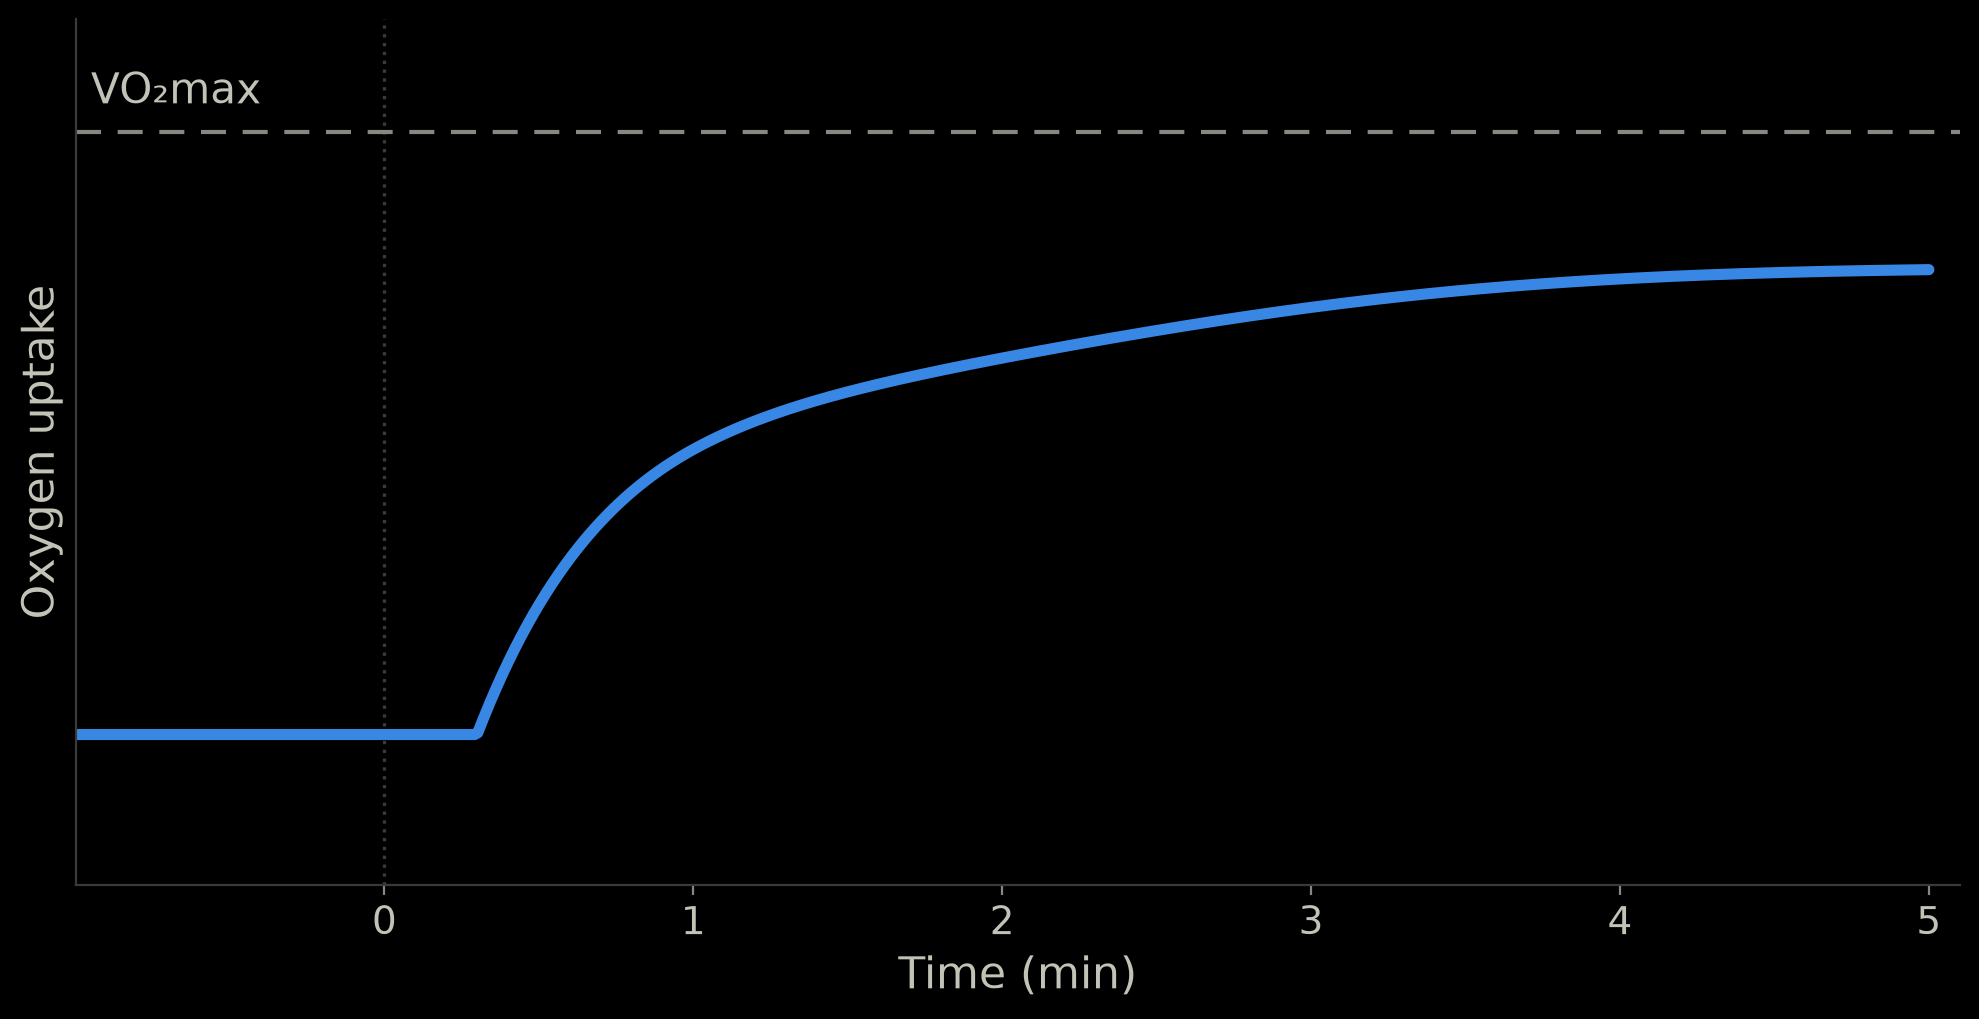
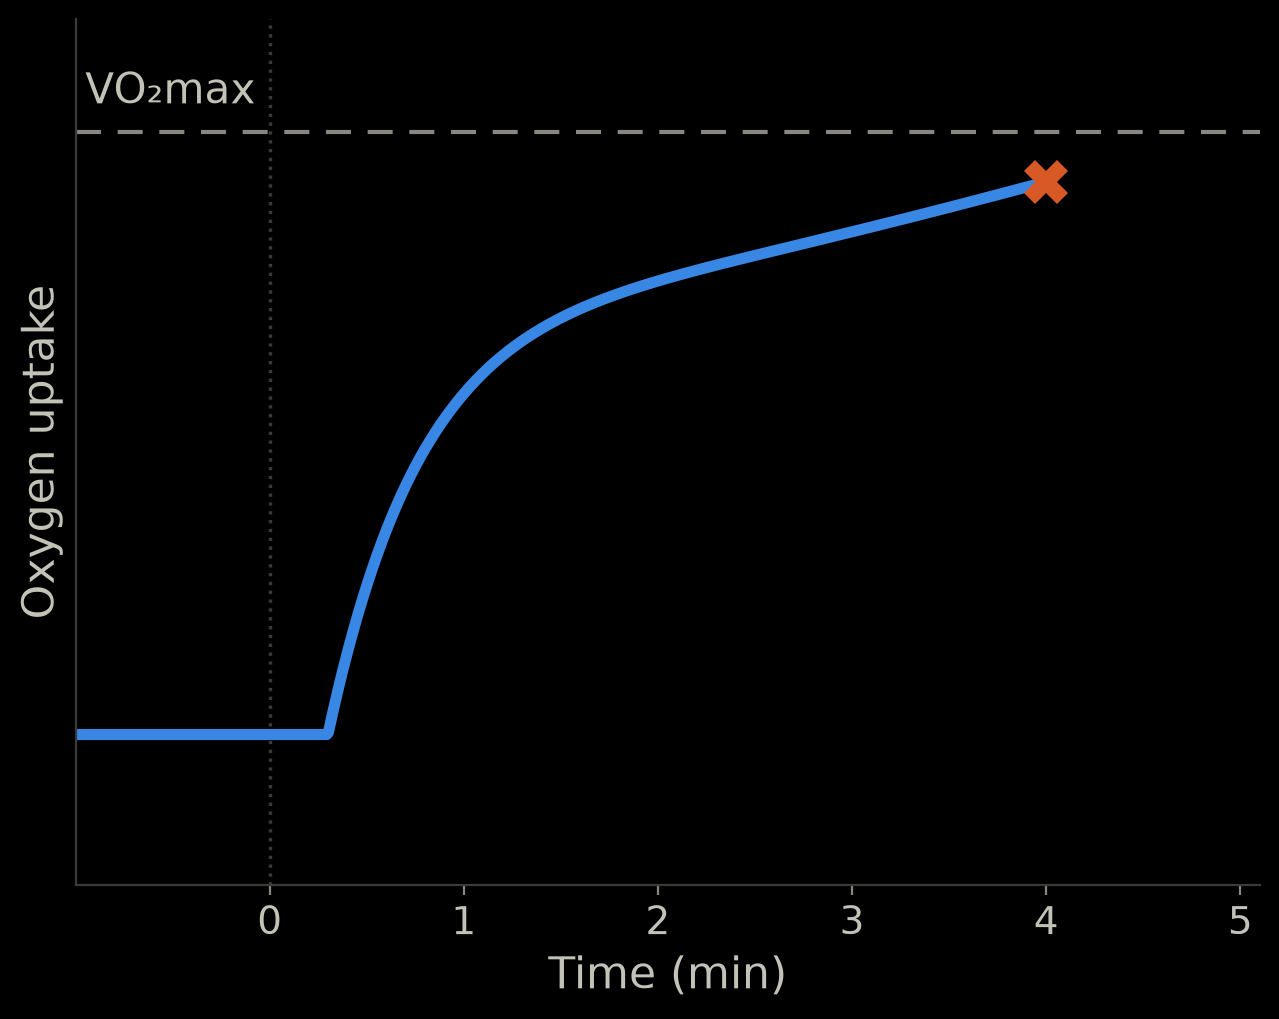
Schematic: oxygen uptake rises quickly, then keeps creeping up for several minutes, staying below VO2max

Heavy

How was the data supposed to look?
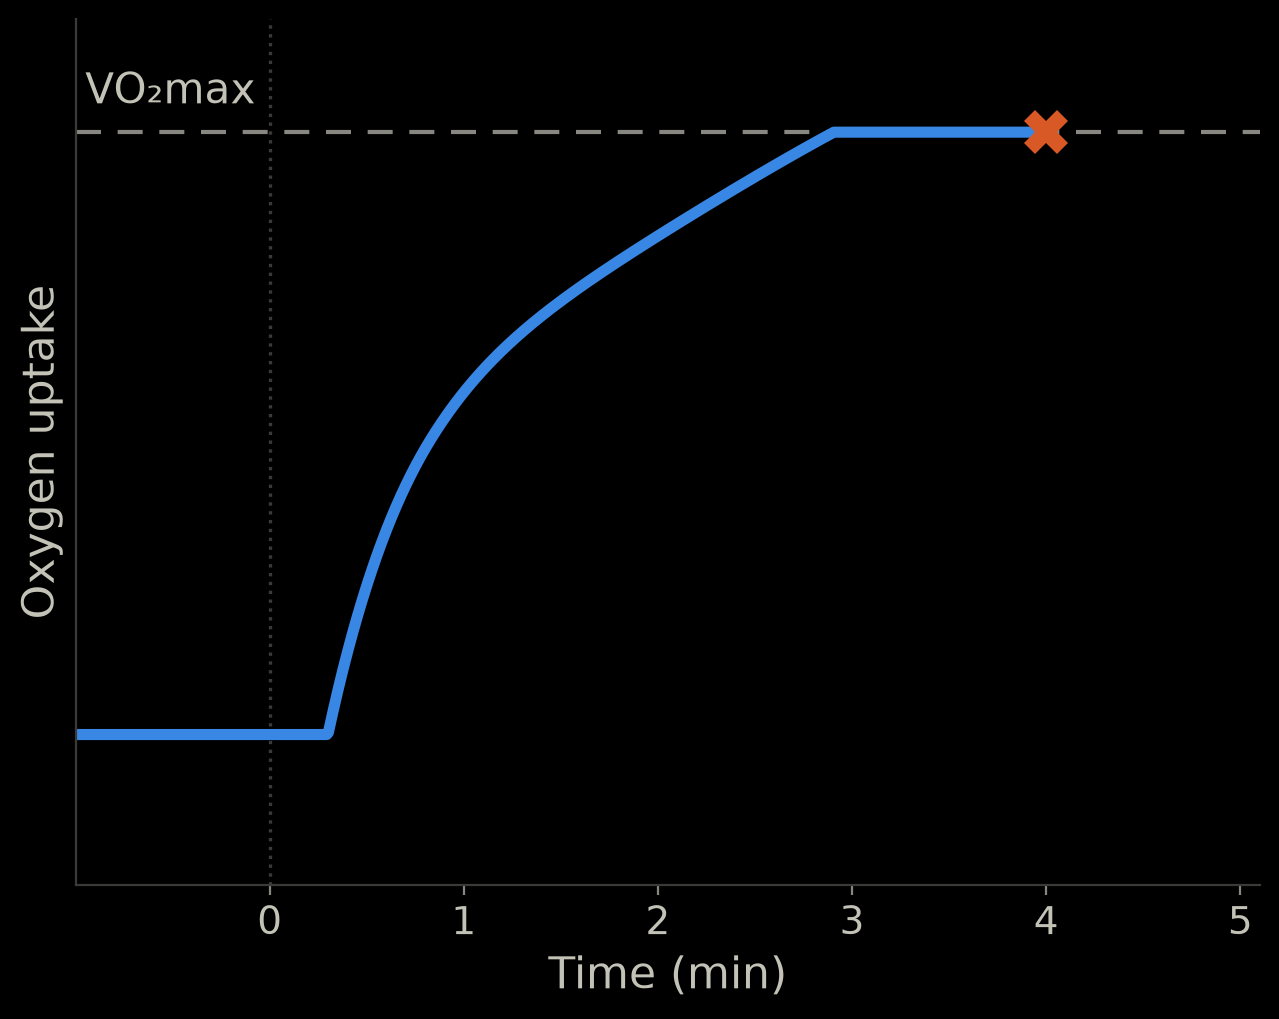
Schematic: oxygen uptake keeps rising, reaches VO2max at about 3 minutes and stays there until the stop at 4 minutes
Schematic: oxygen uptake keeps rising and is still below VO2max at the stop at 4 minutes

Severe

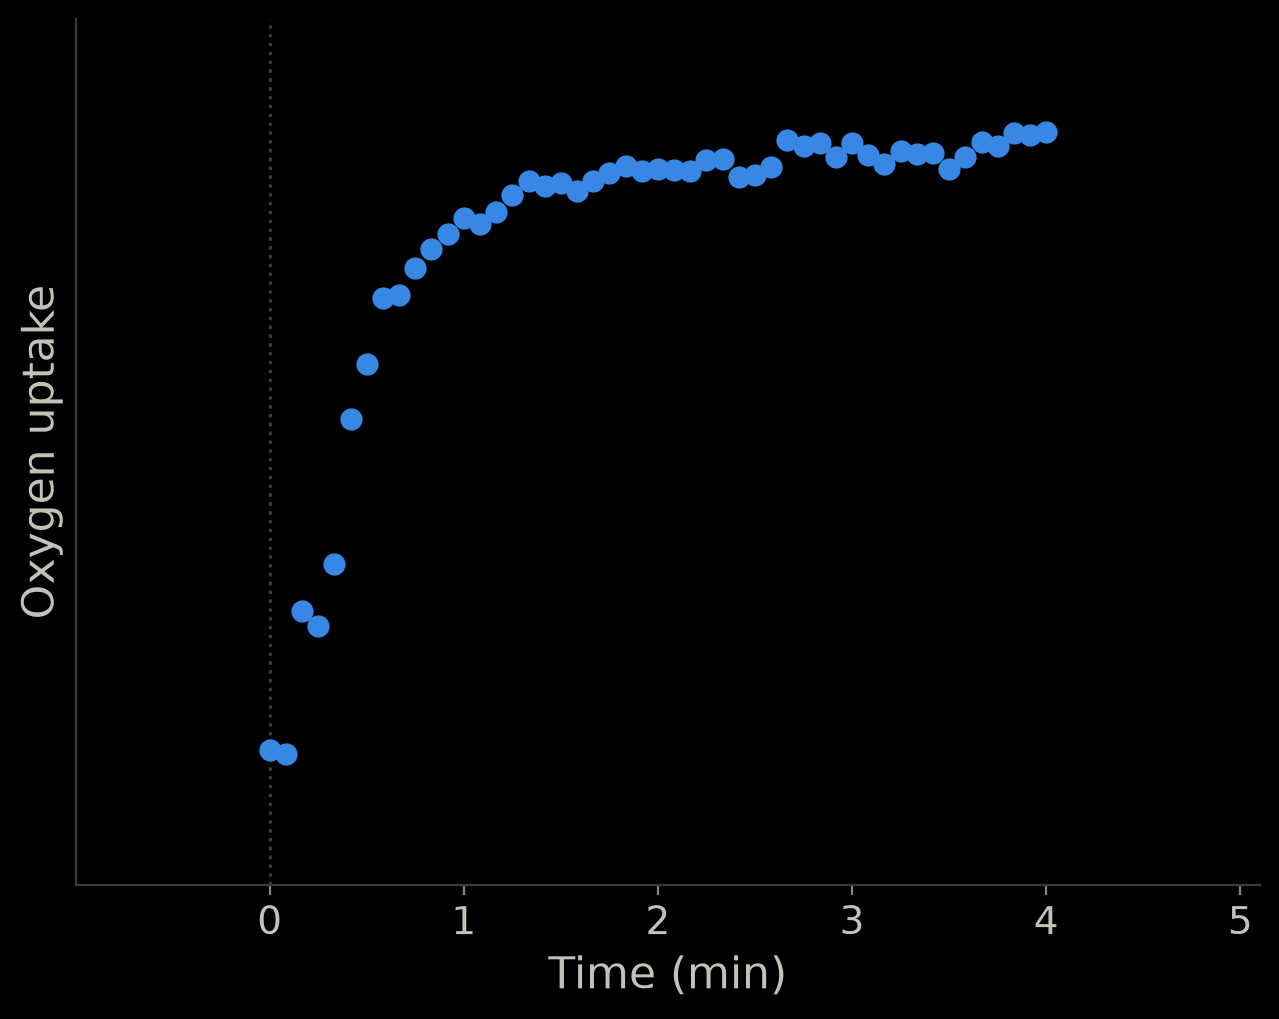
How did the data actually look?
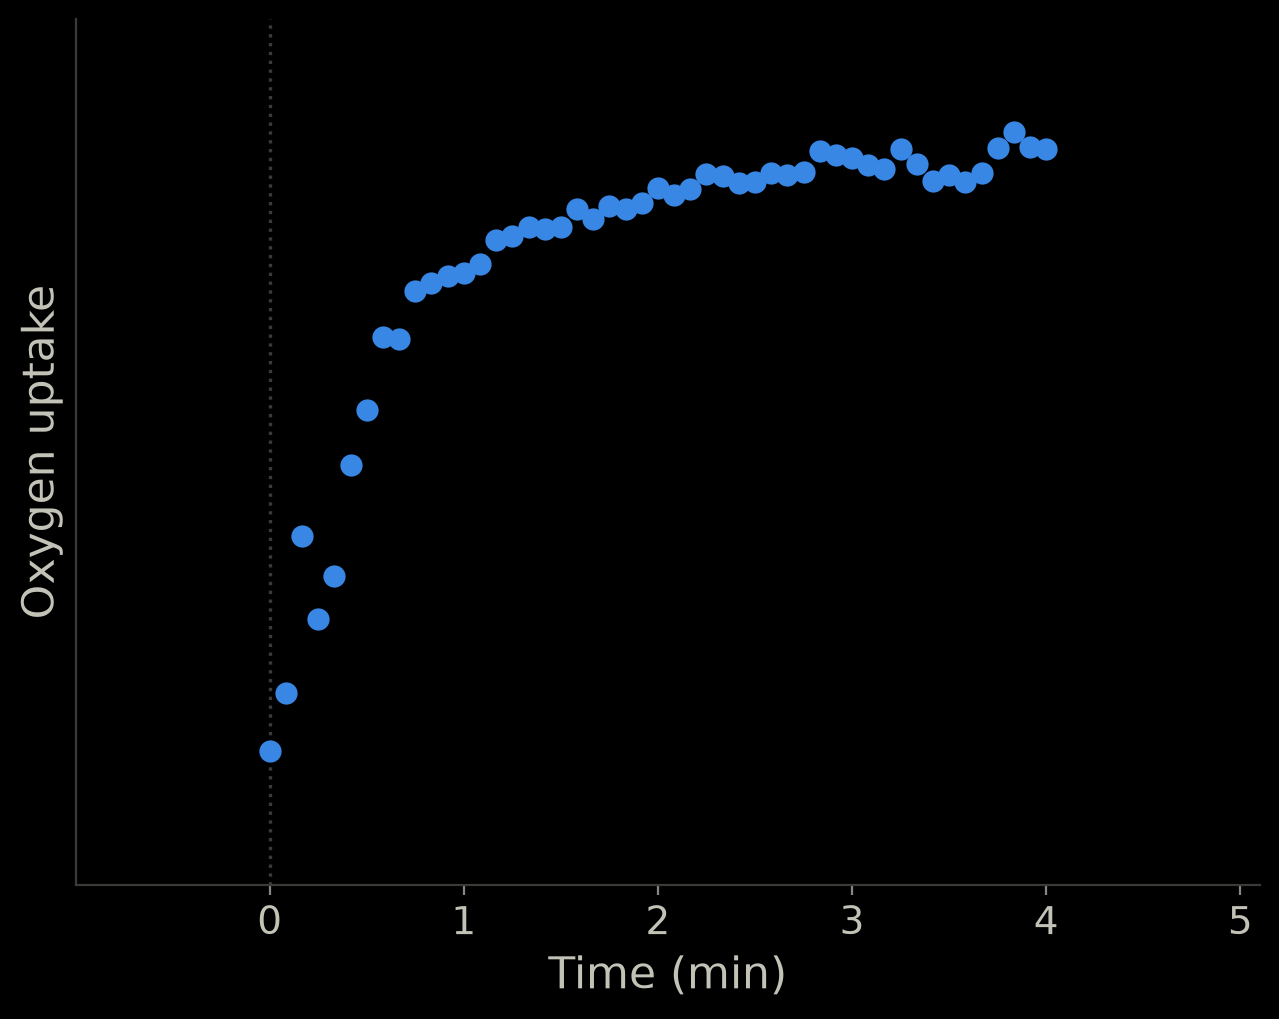
Empty graph: oxygen uptake against time in minutes One runner's measured oxygen uptake every 5 seconds over the 4-minute bout: a steep rise in the first minute, then a slow creep upward

Runner

Empty graph: oxygen uptake against time in minutes One cyclist's measured oxygen uptake every 5 seconds over the 4-minute bout: a steep rise in the first minute, then nearly flat with a slight creep upward

Cyclist

How did the data actually look?
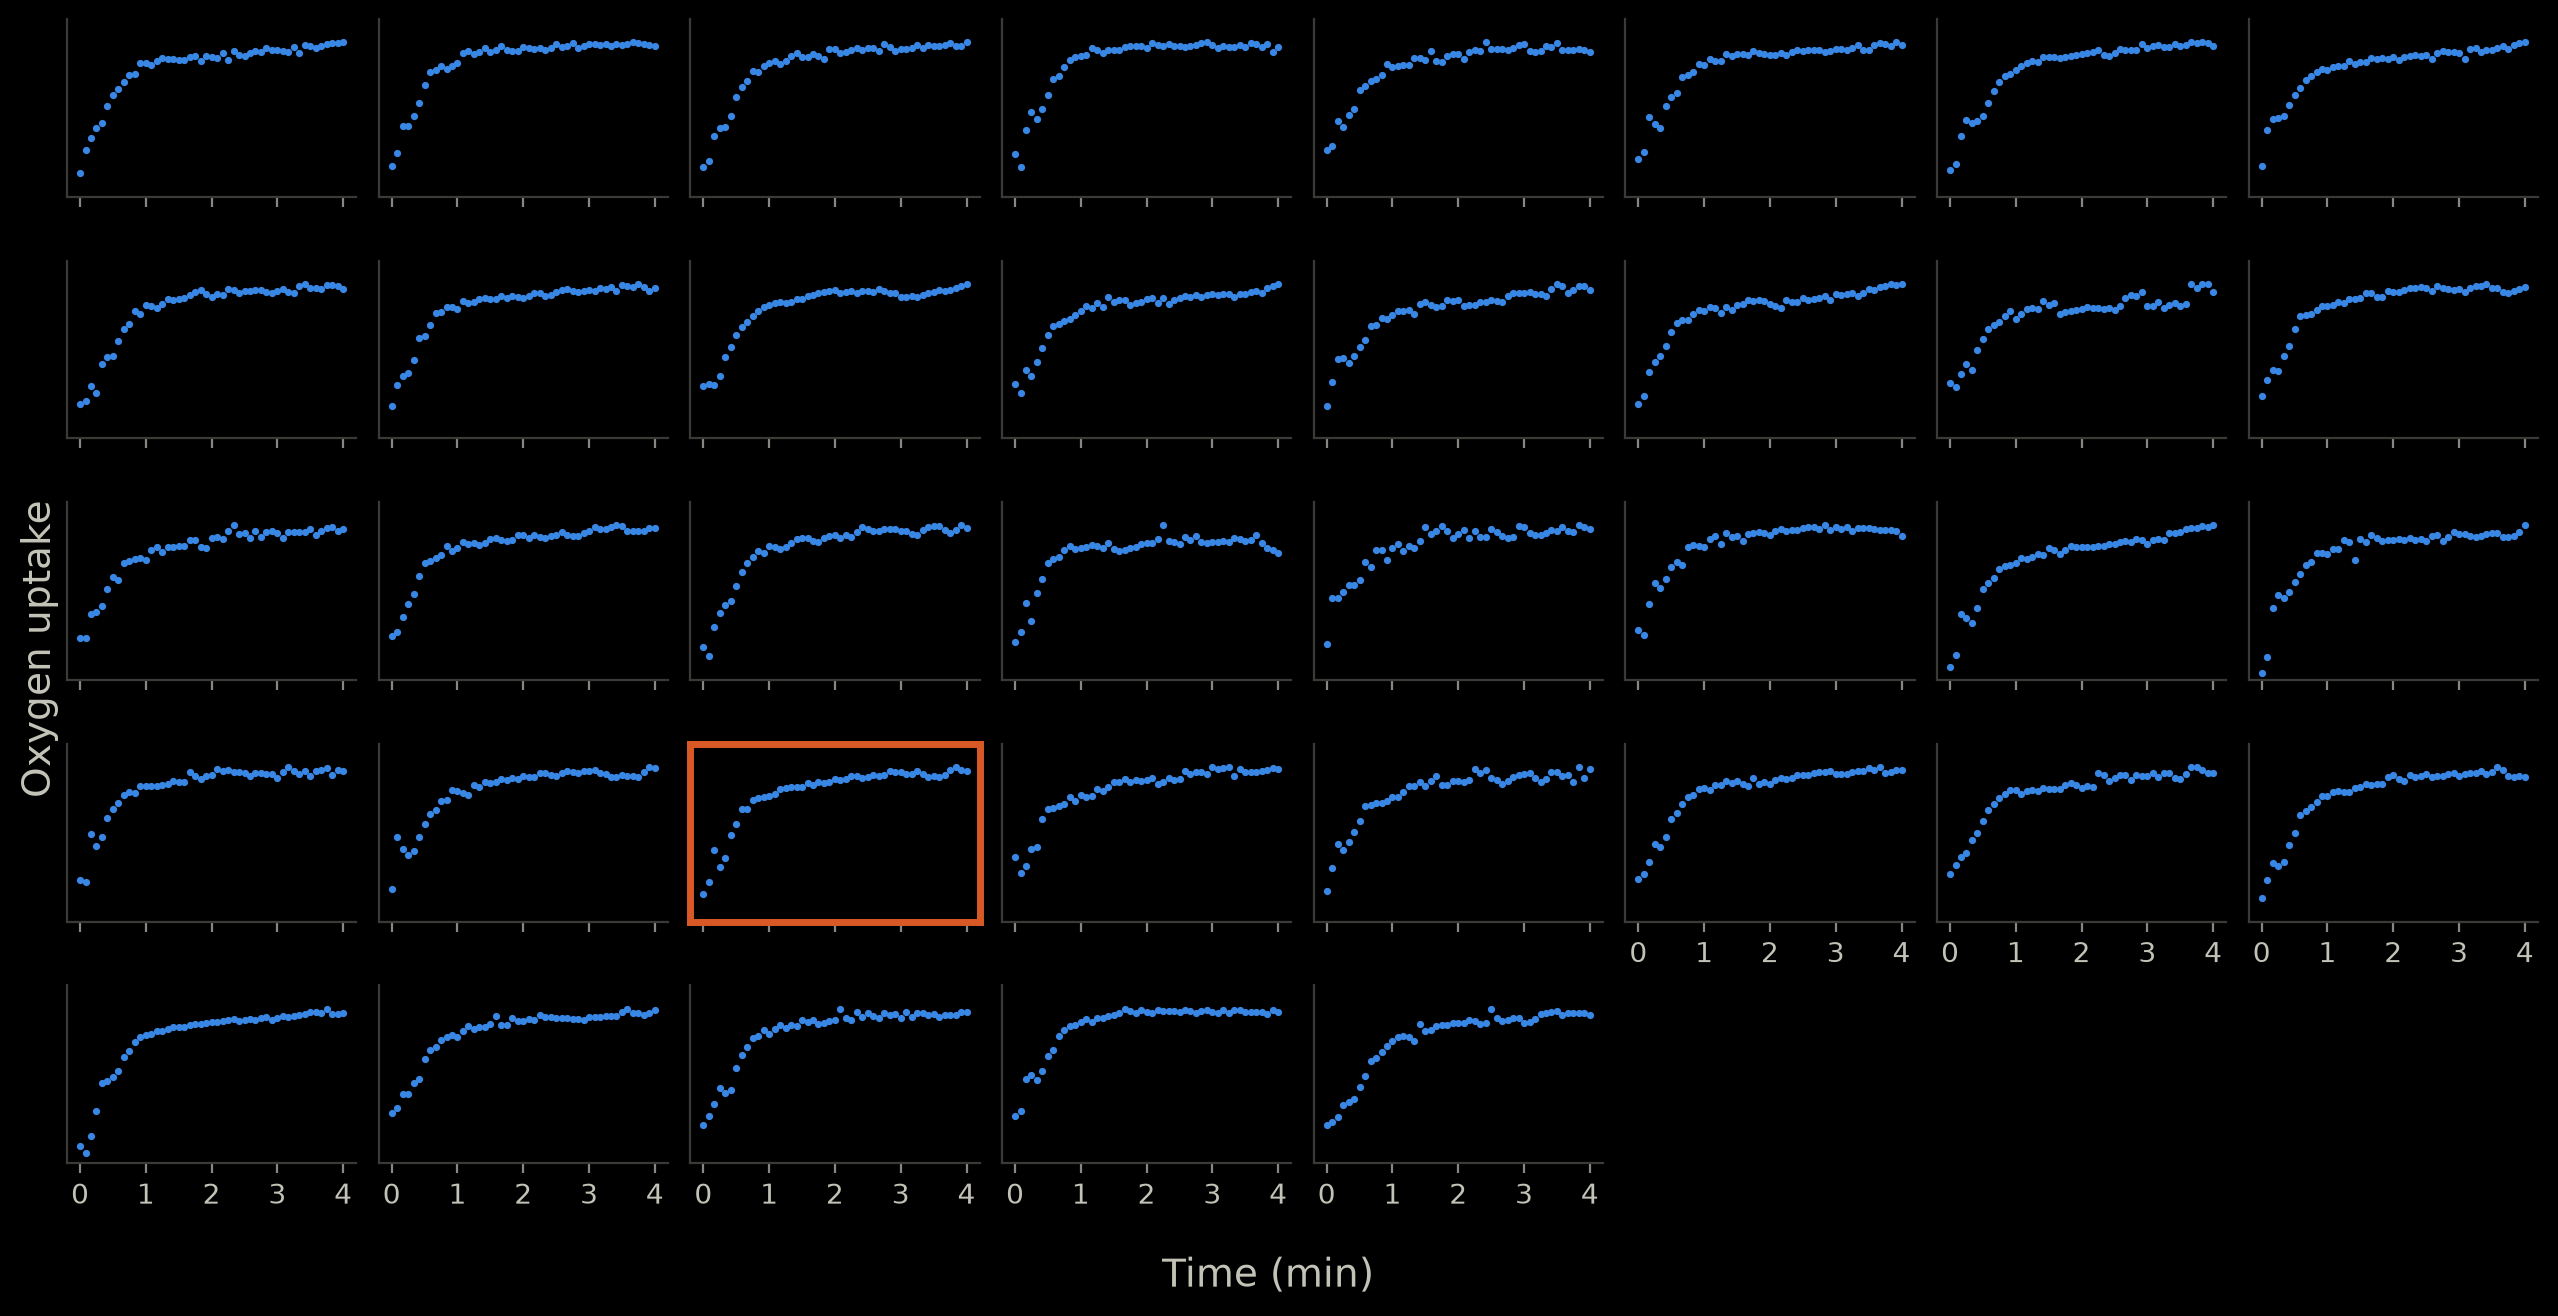
All 37 runners: one small graph per person of measured oxygen uptake over the 4-minute bout, each scaled to the person's own maximum

Runners (n = 37)

How did the data actually look?
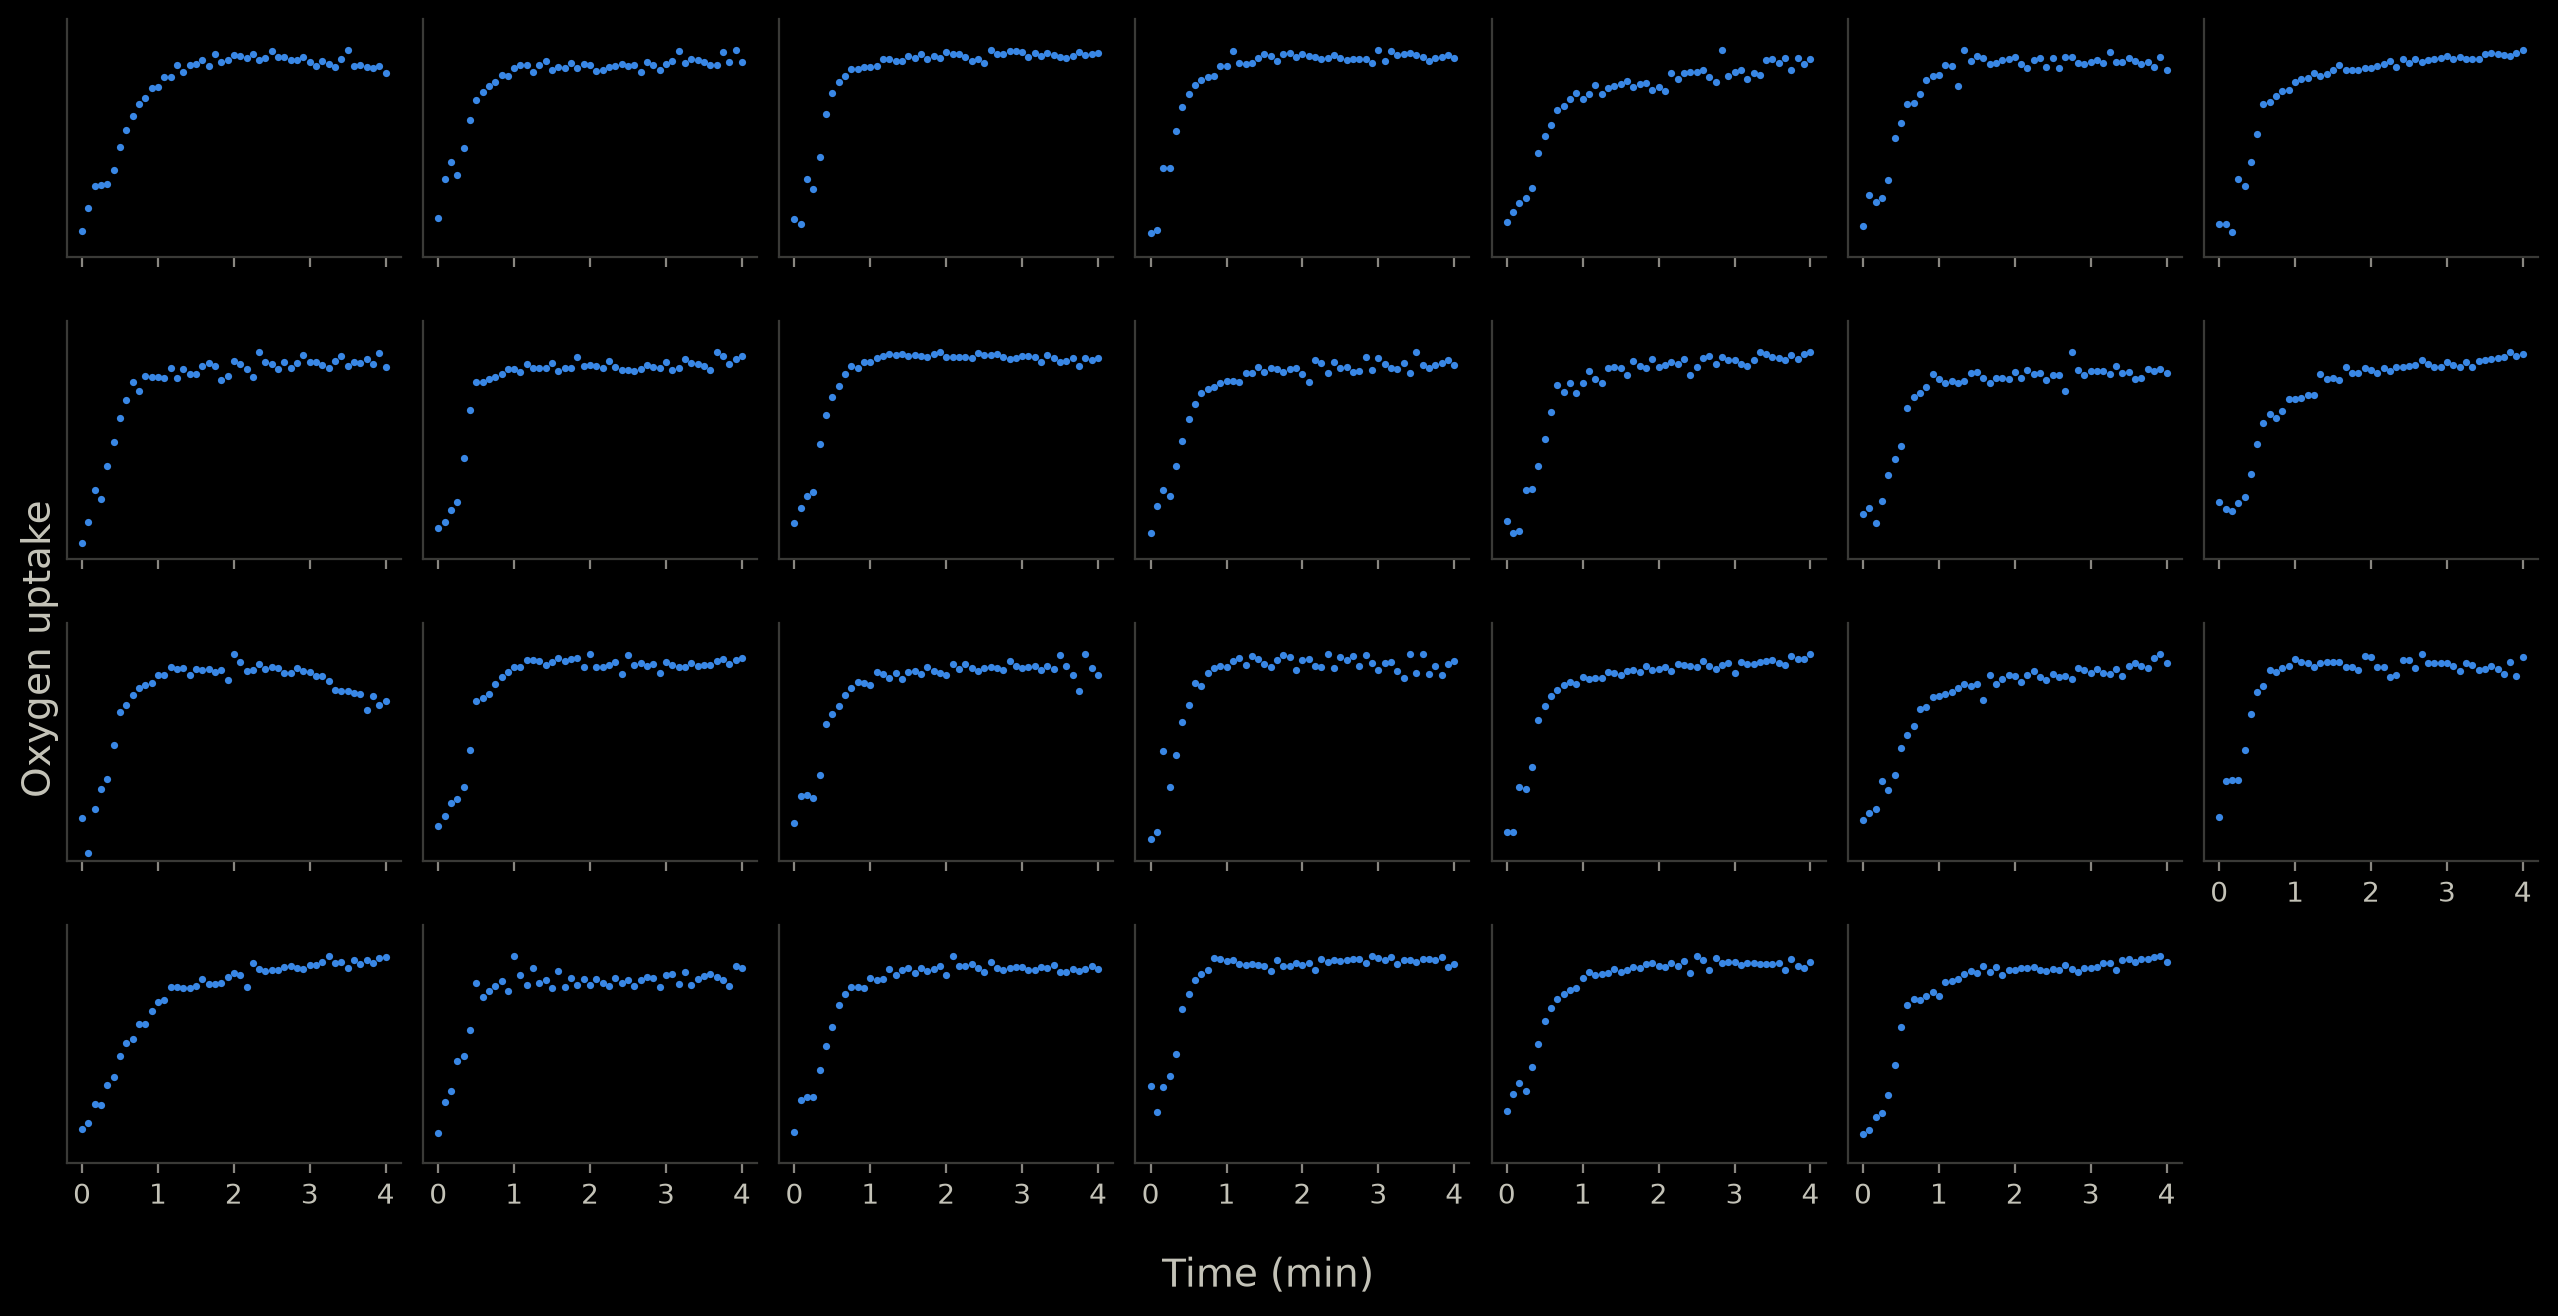
All 27 cyclists, first trial: one small graph per person of measured oxygen uptake over the 4-minute bout, each scaled to the person's own maximum

Cyclists, first trial (n = 27)

How did the data actually look?
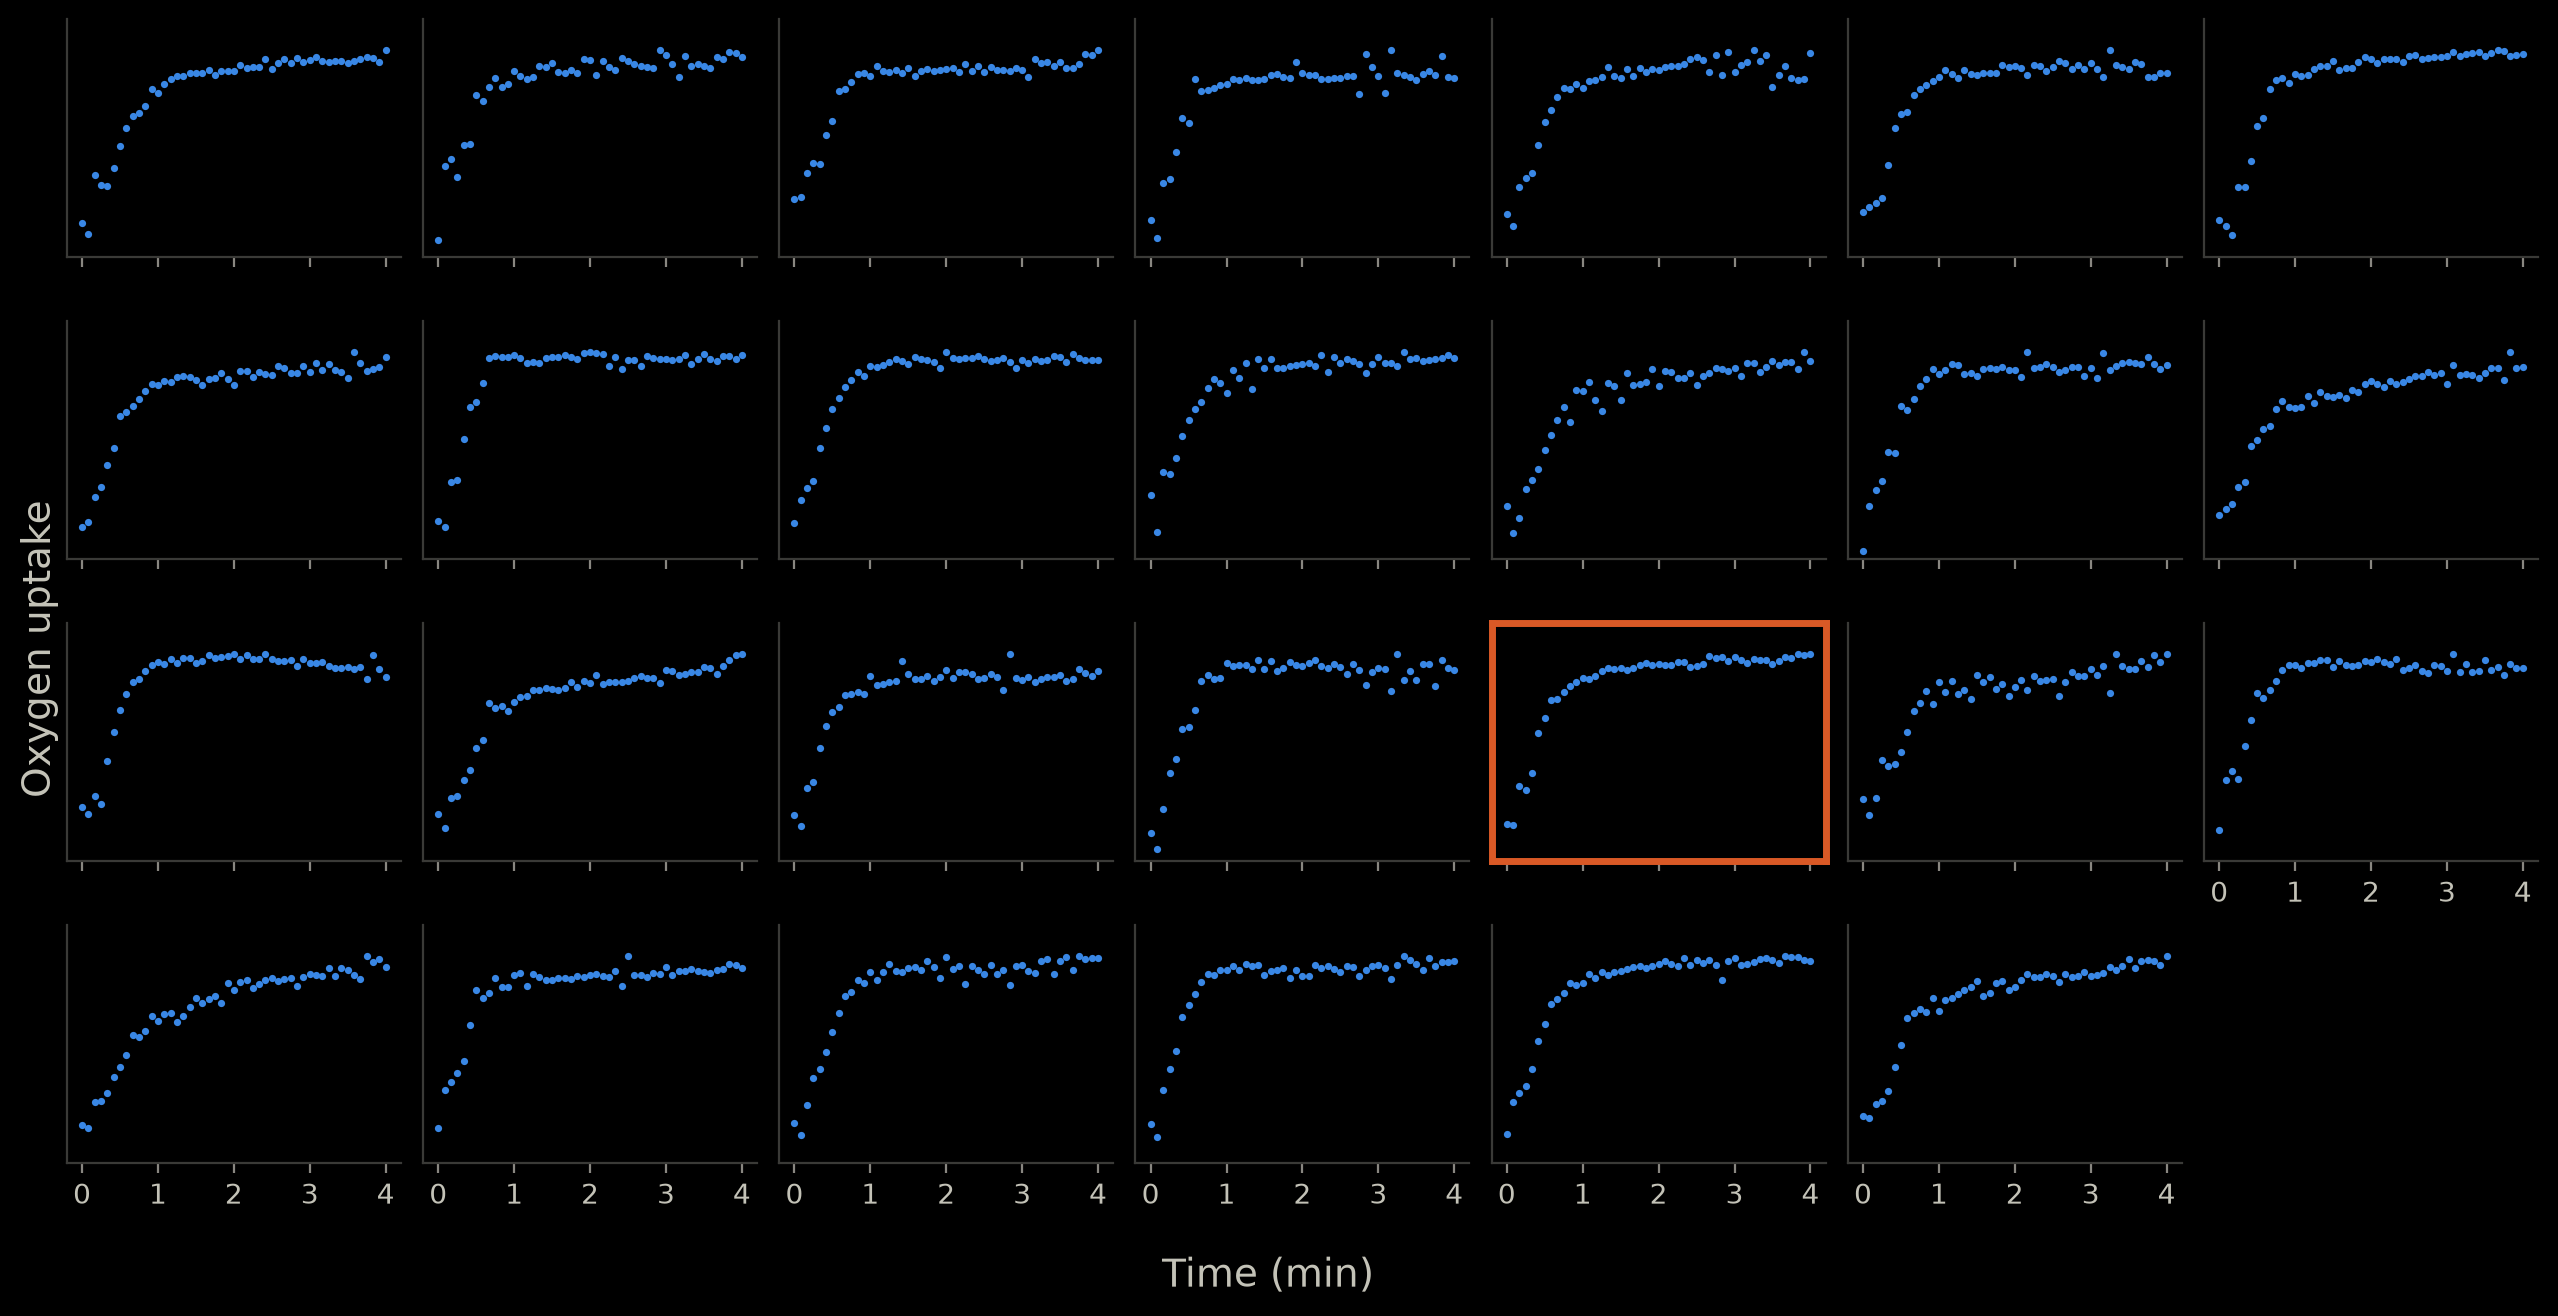
All 27 cyclists, second trial: one small graph per person of measured oxygen uptake over the 4-minute bout, each scaled to the person's own maximum

Cyclists, second trial (n = 27)

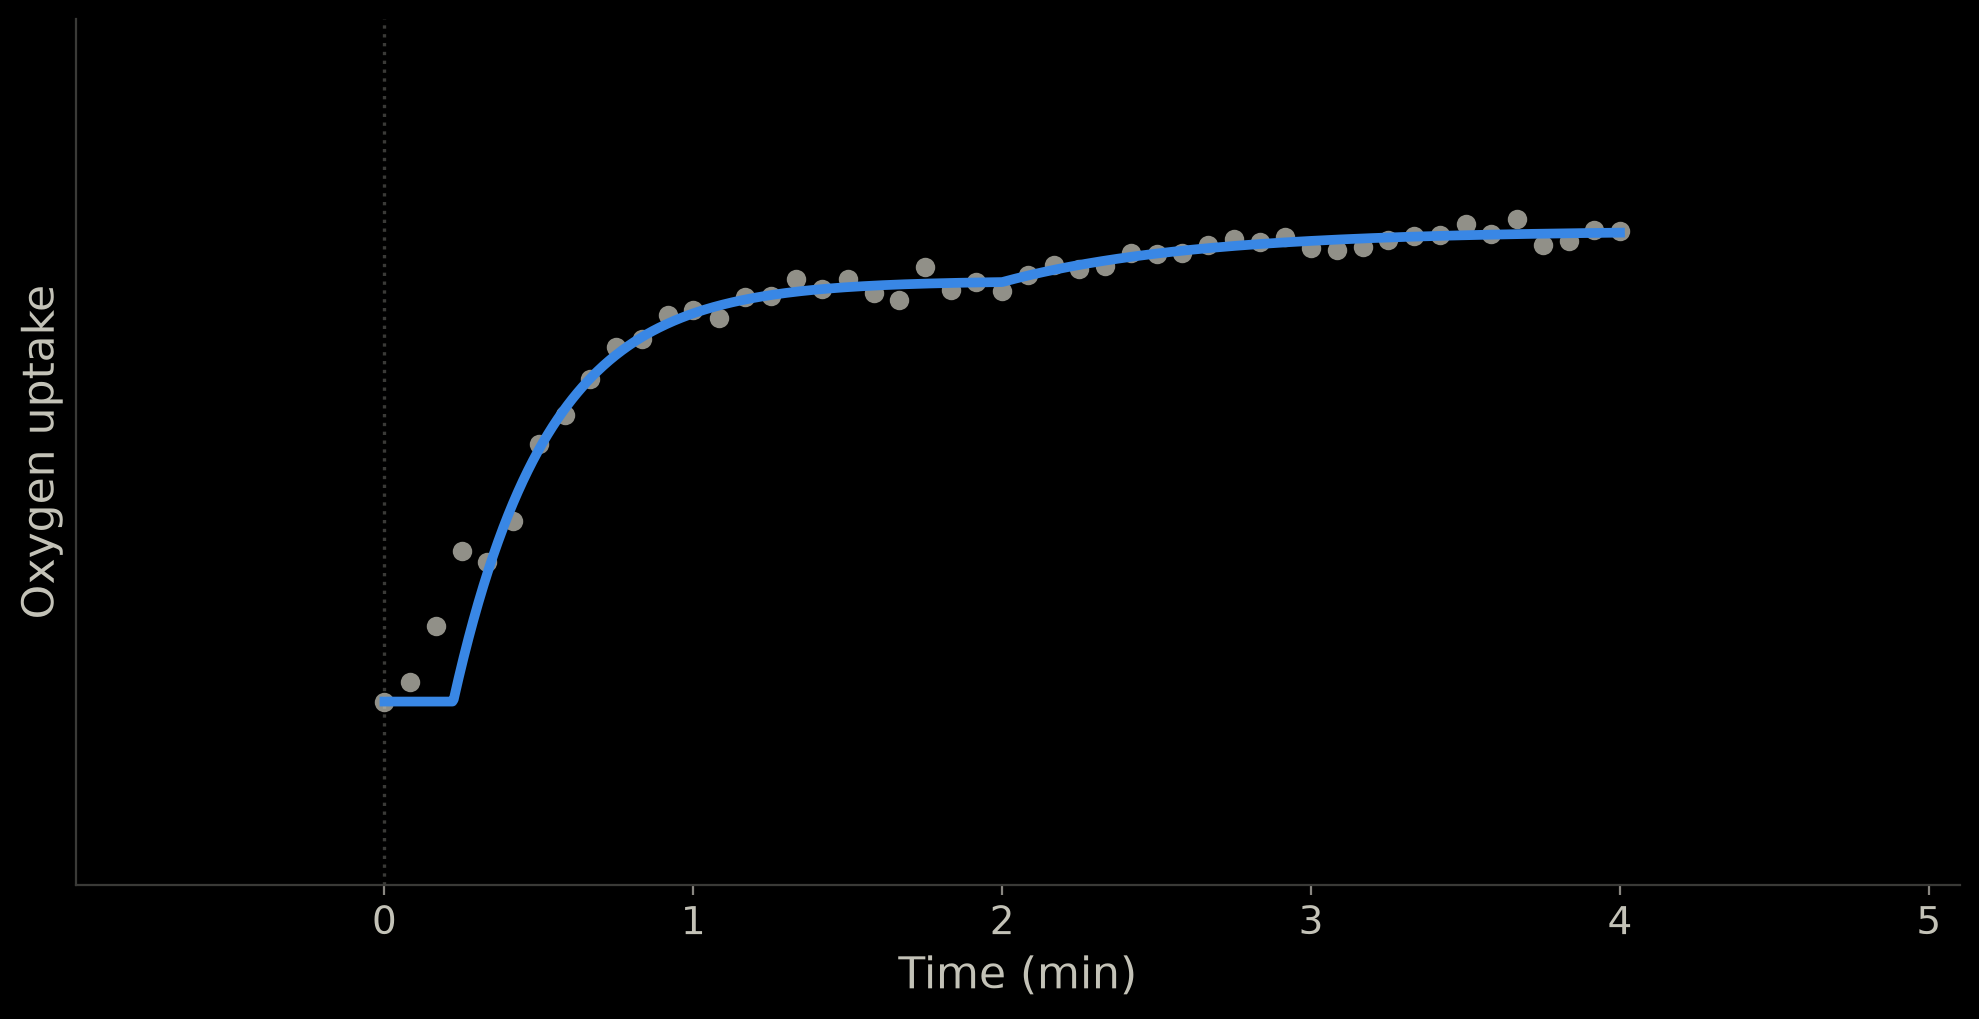
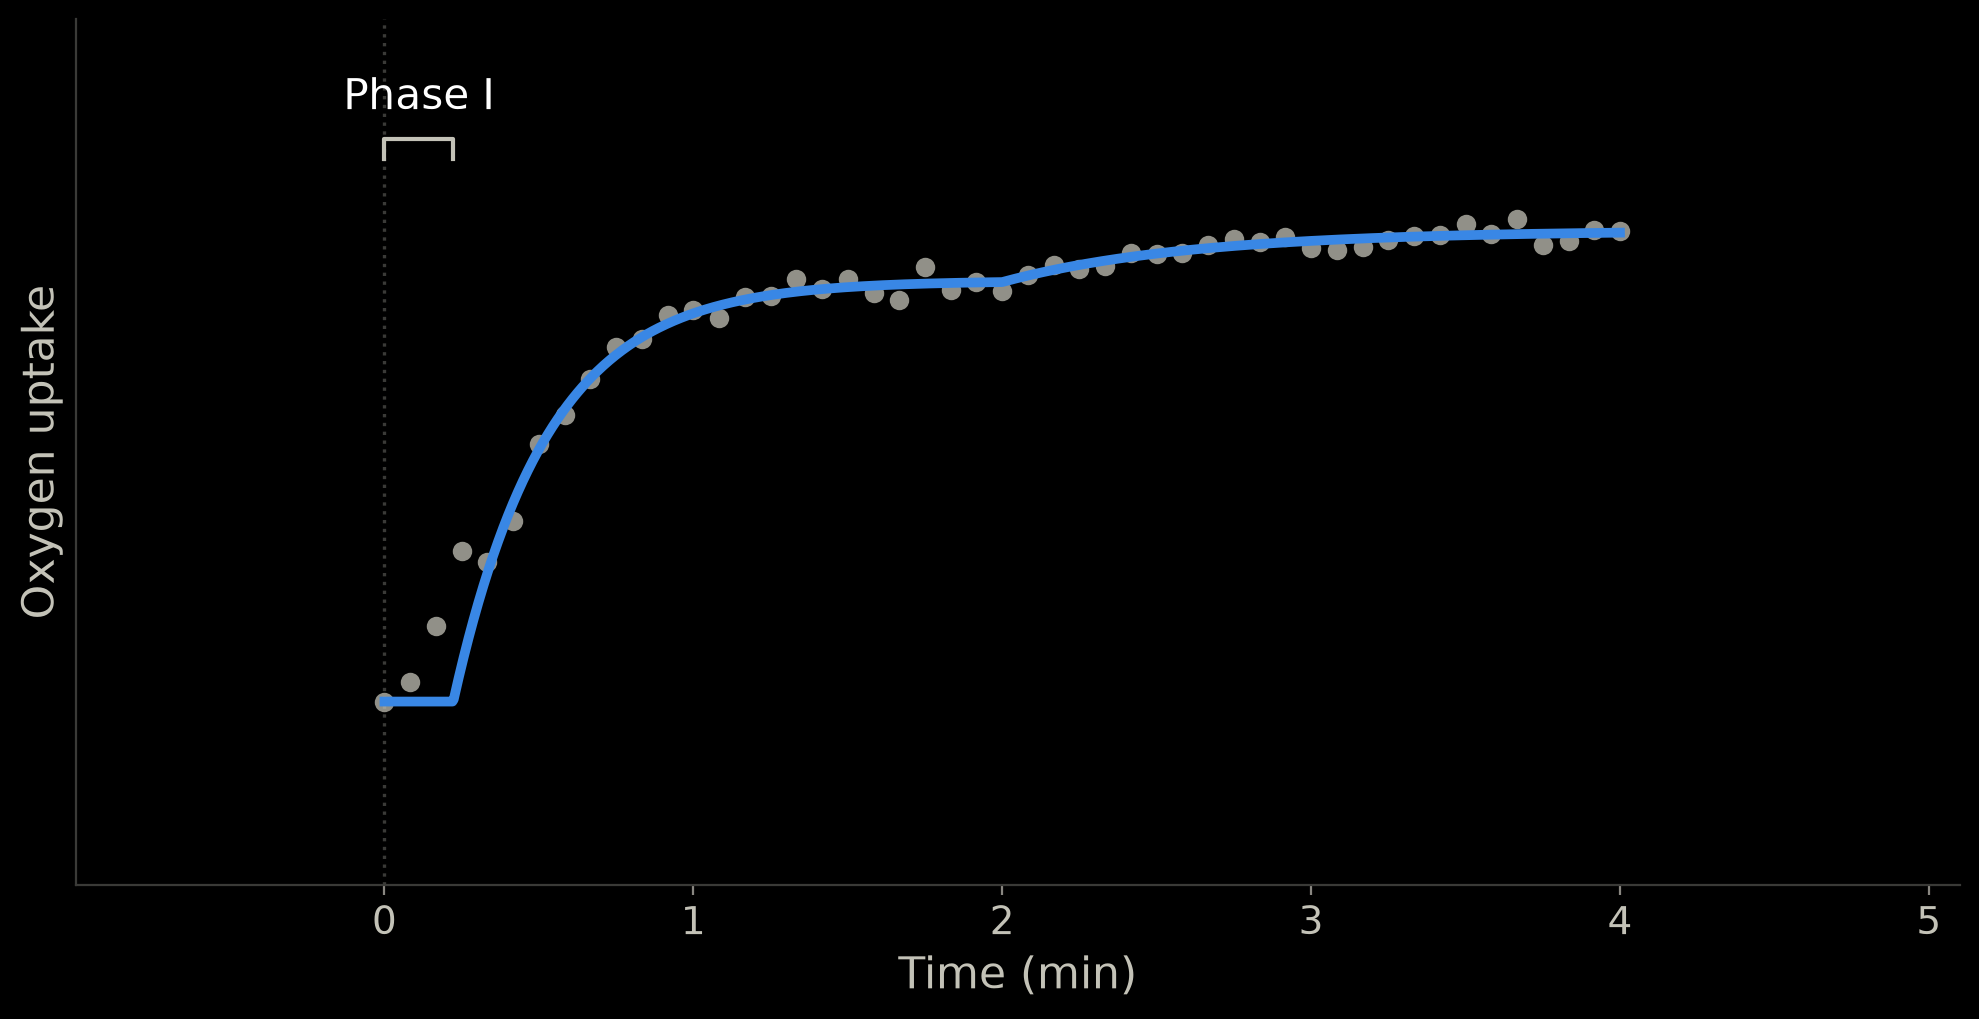
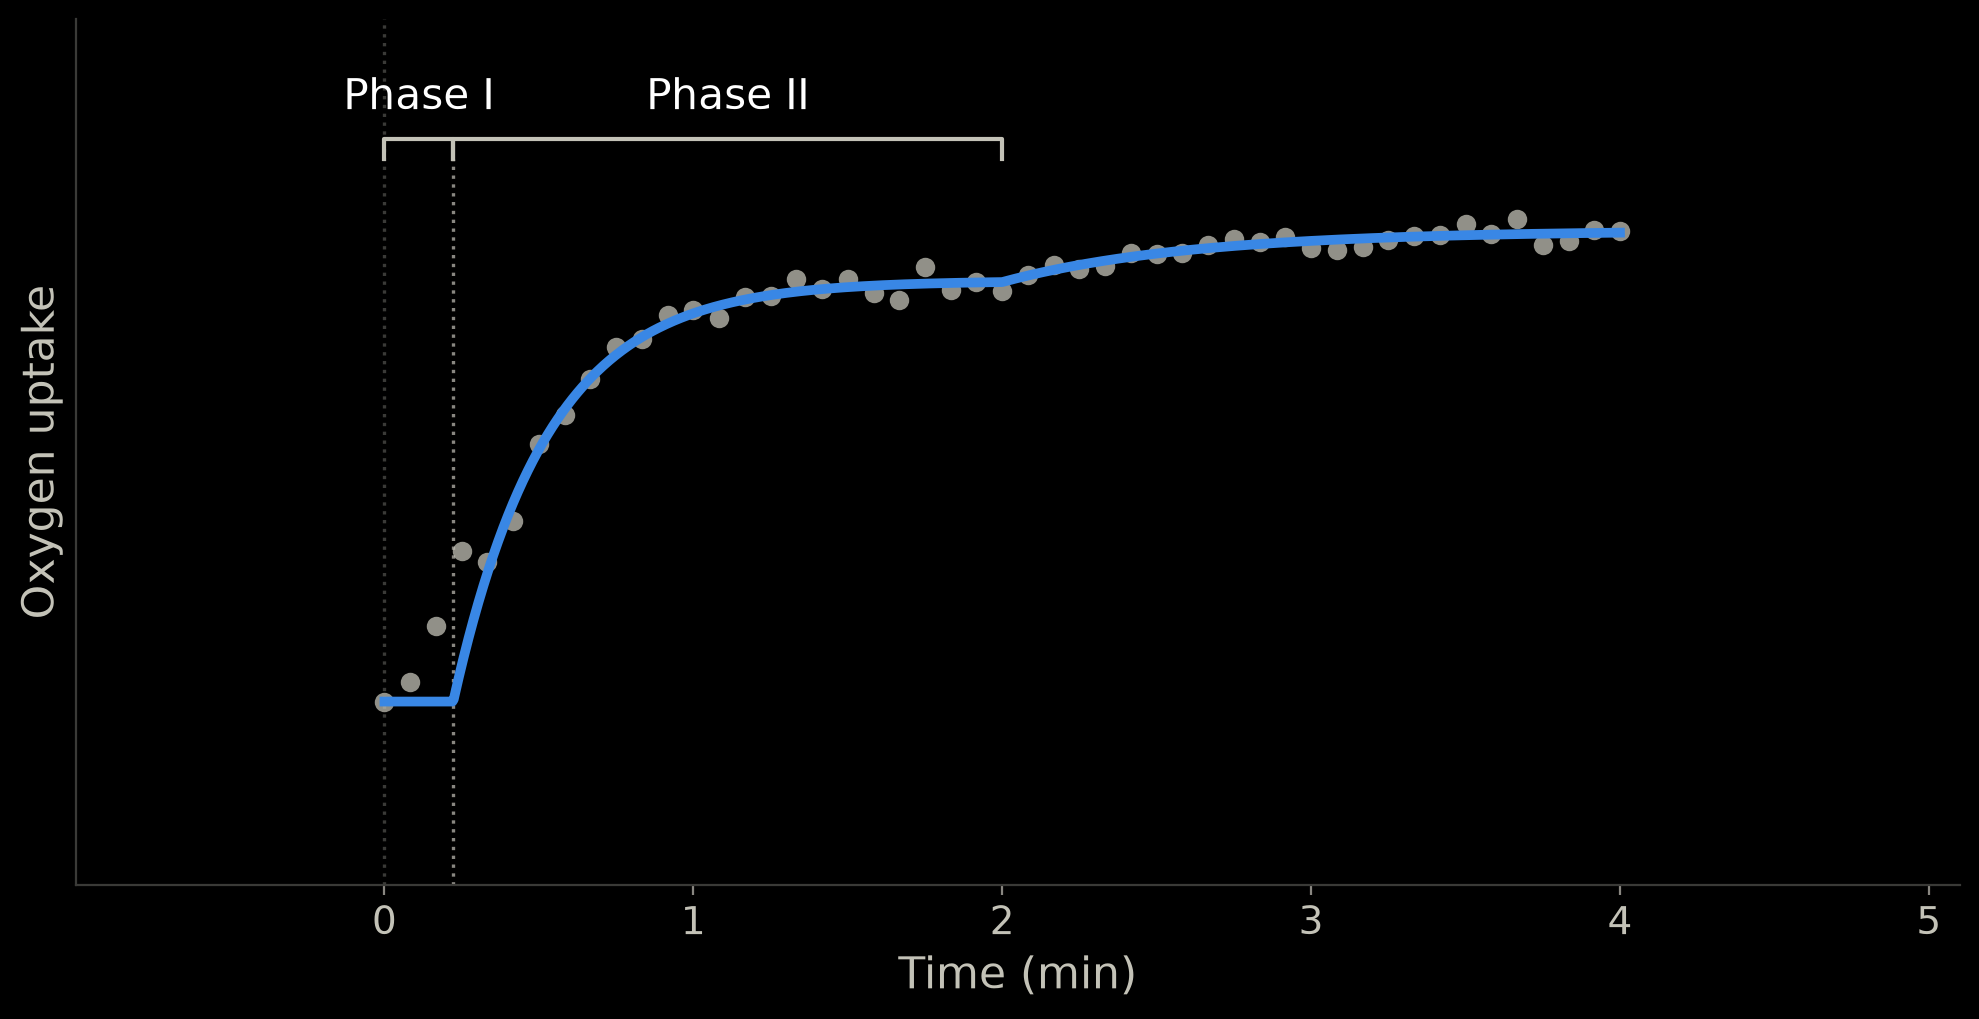
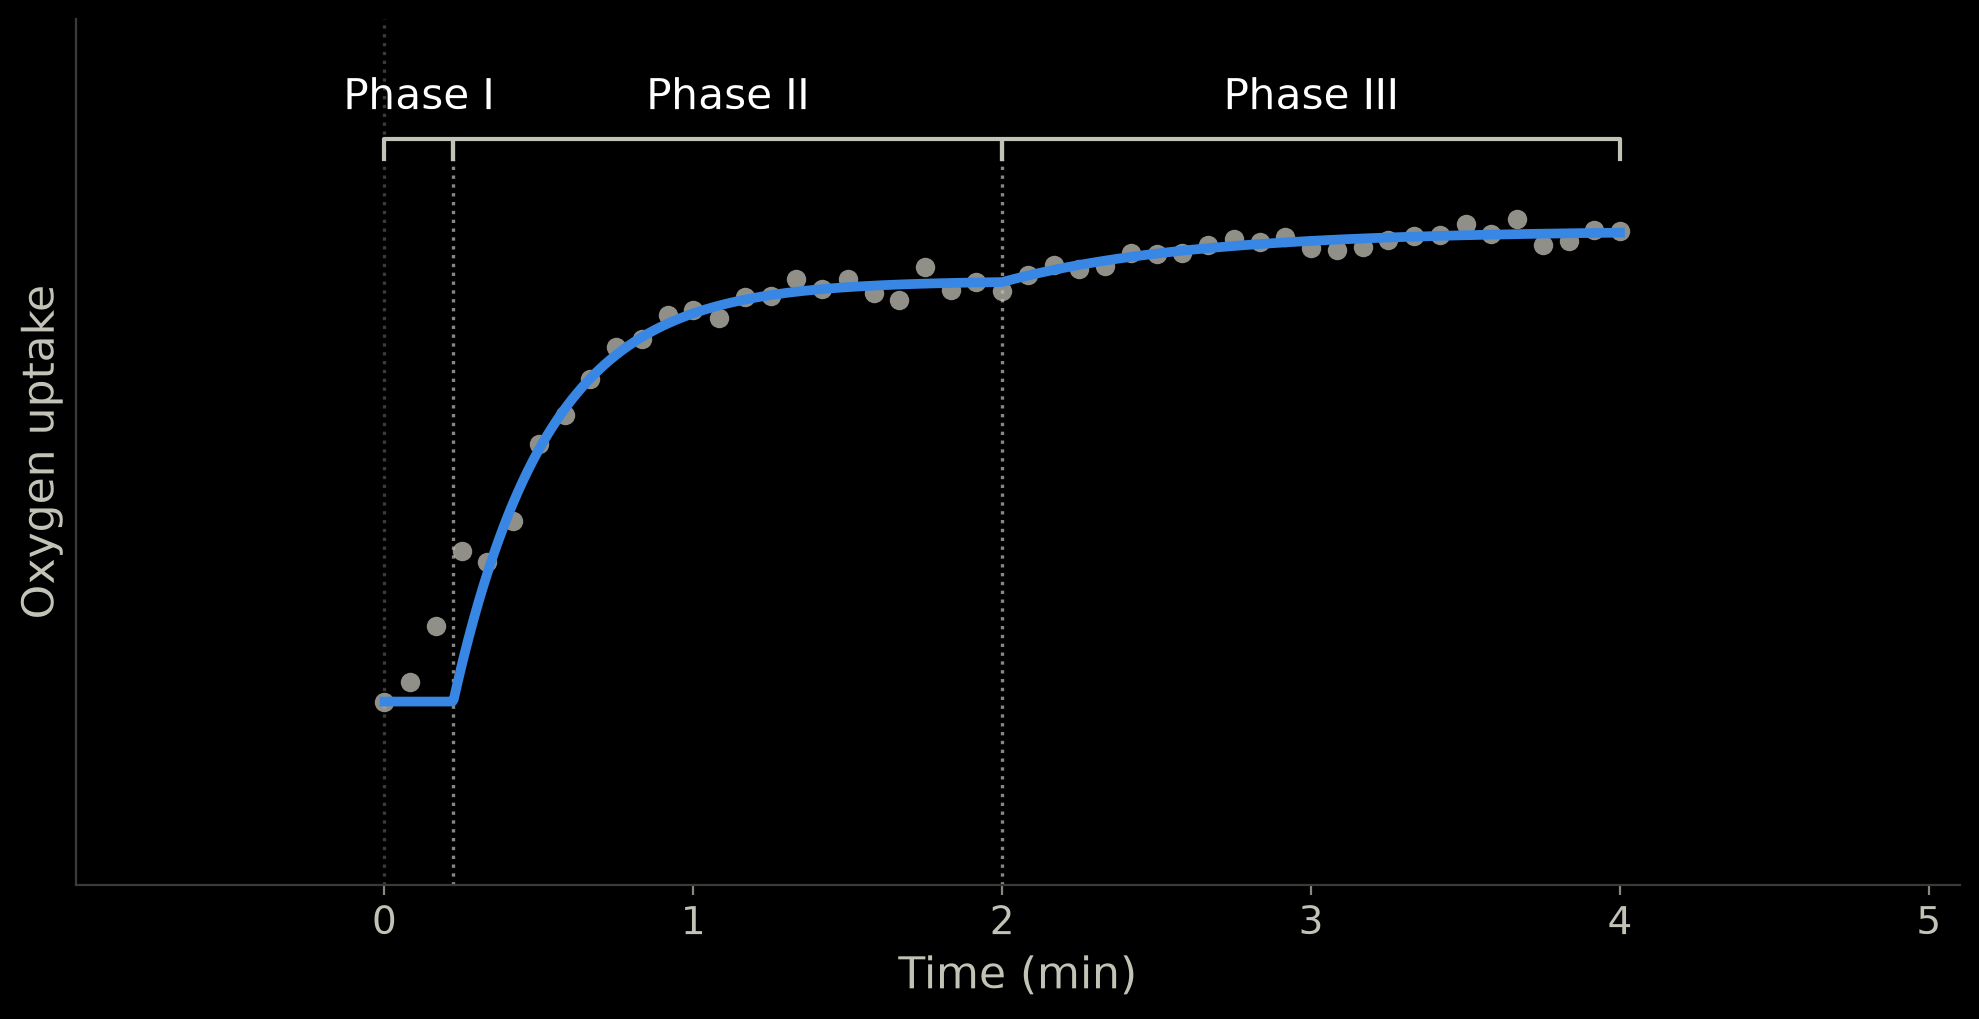
How VO₂ kinetics are usually modeled.
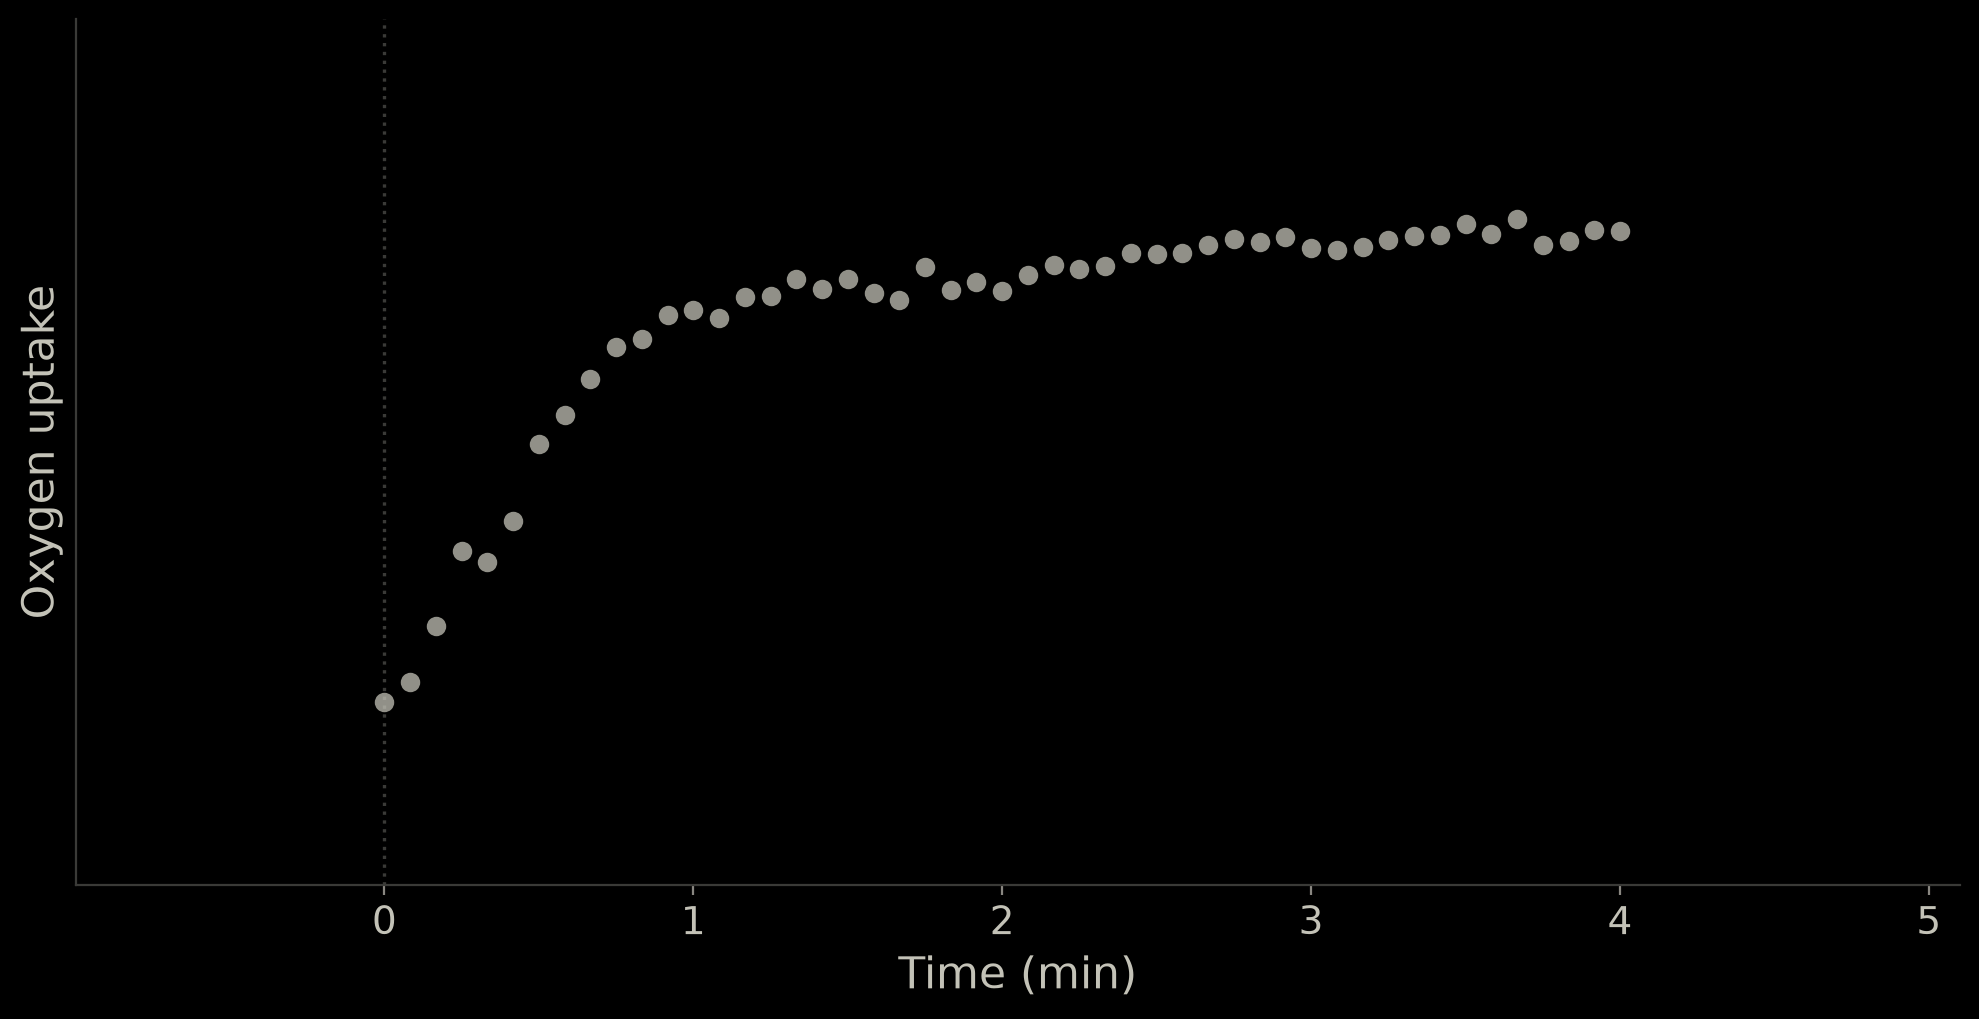
One runner's measured oxygen uptake every 5 seconds over the 4-minute bout The same data with the fitted bi-exponential curve Phase I marked: from the start to the beginning of the main rise Phase II marked: the main rise, until about 2 minutes Phase III marked: the slow rise from about 2 minutes to the end

Issues

  • Pain to implement
  • Requires arbitrary starting parameters
  • Potential for overfitting

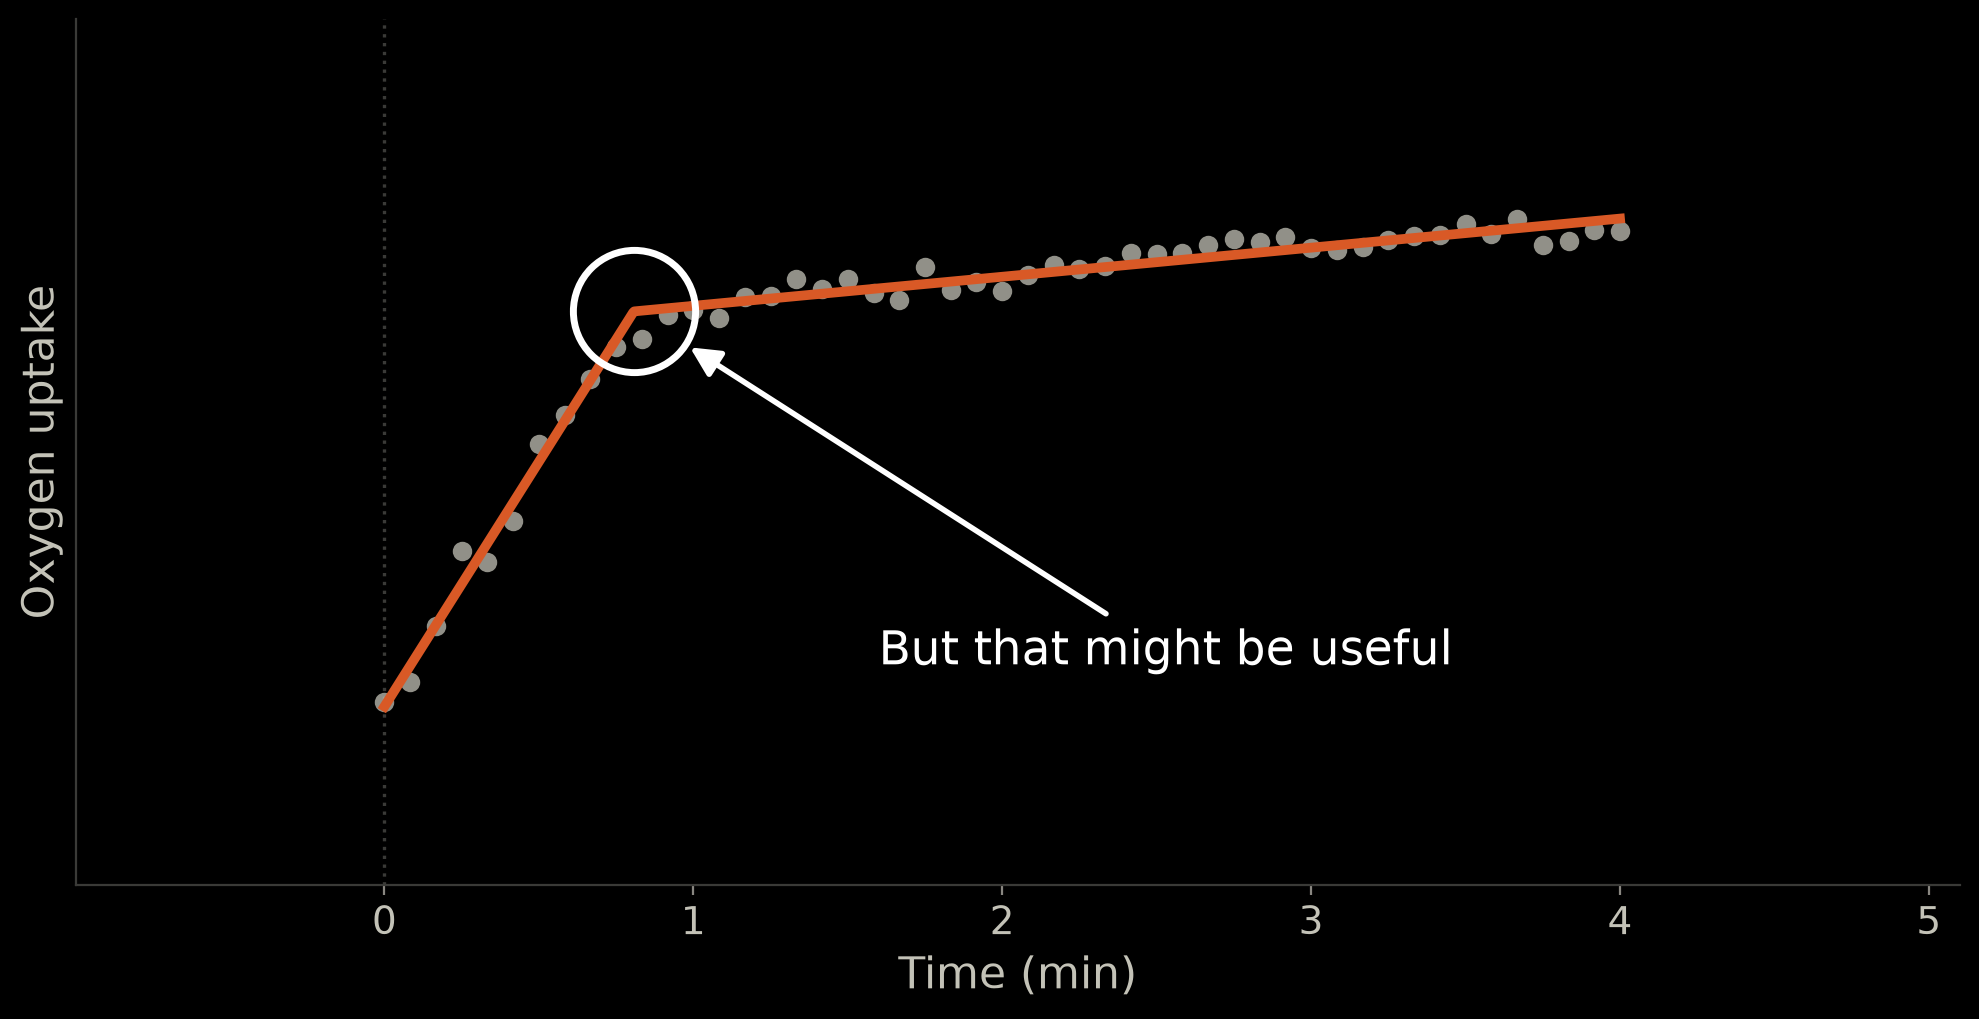
A solution? Probably not.
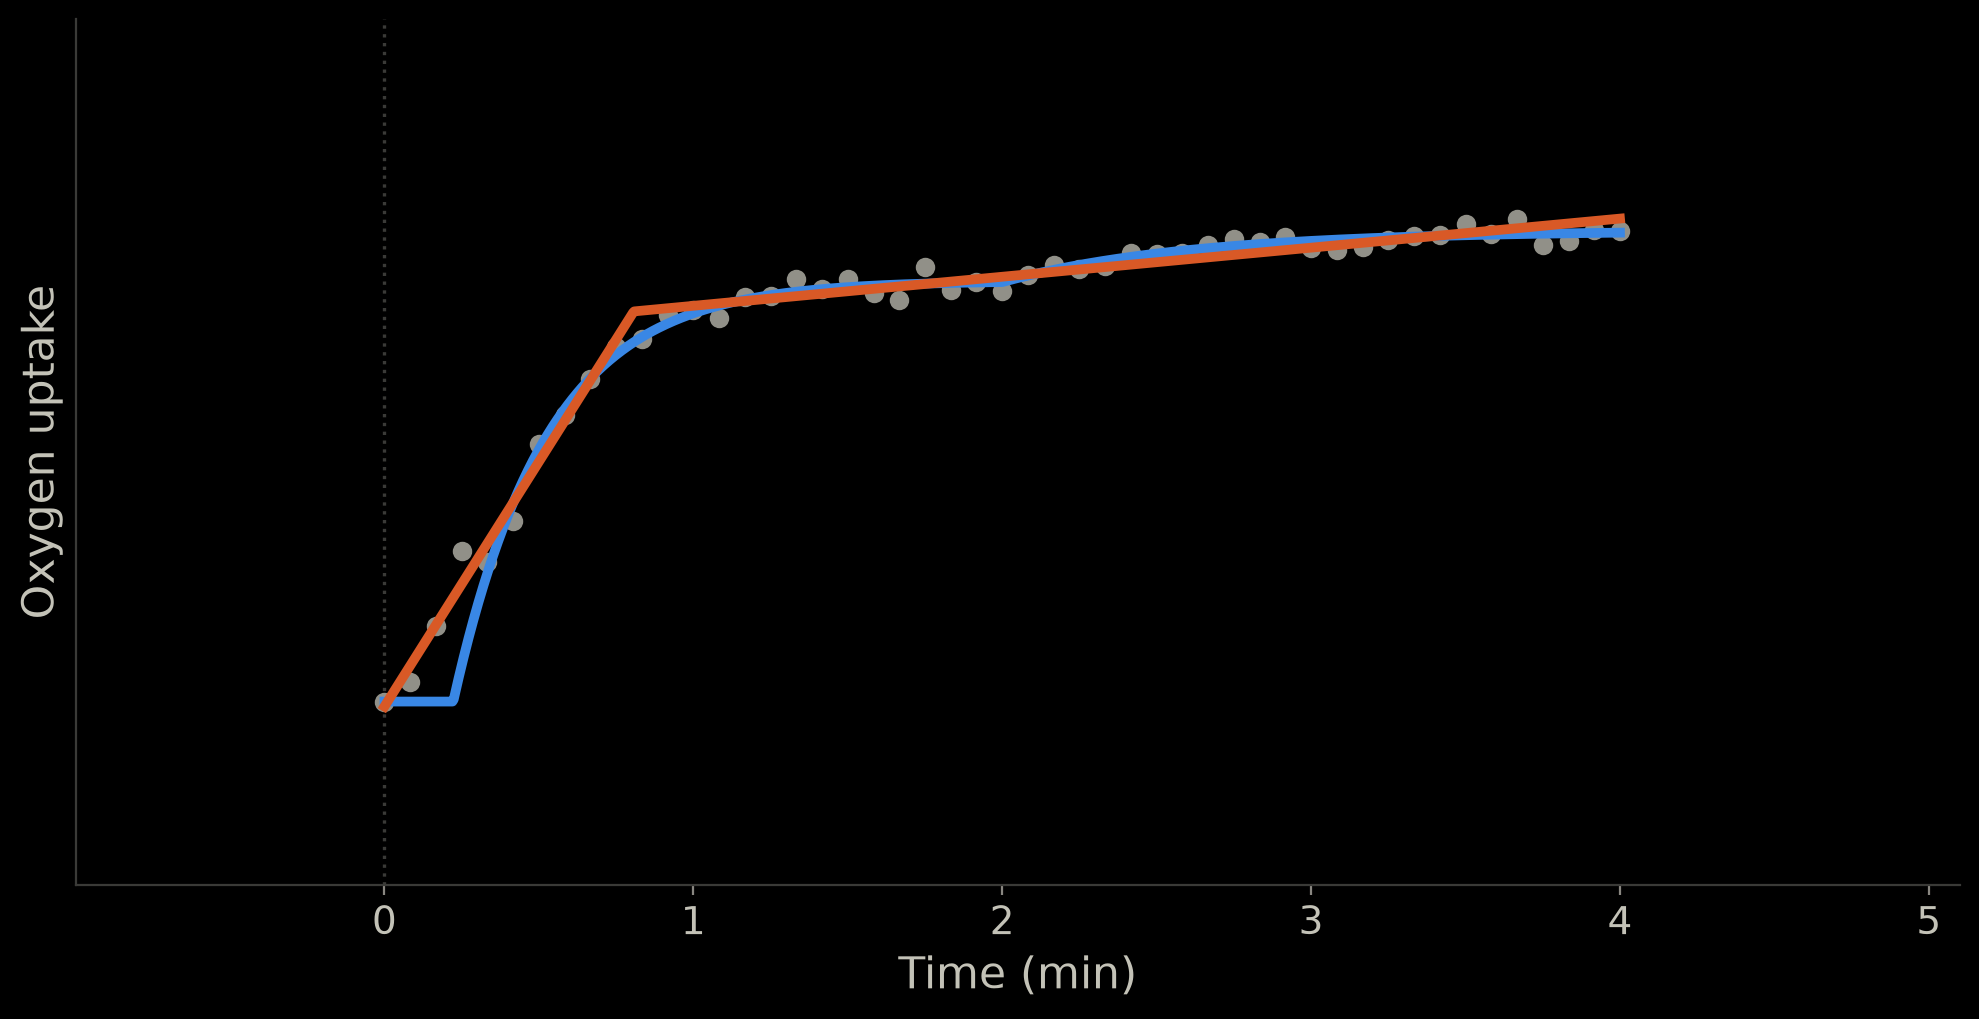
The runner's data with the fitted bi-exponential curve The same data and curve with a two-segment straight-line fit in orange: a steep line for the rise, a shallow one after it The corner where the two straight lines meet is circled, with an arrow and the caption: But that might be useful

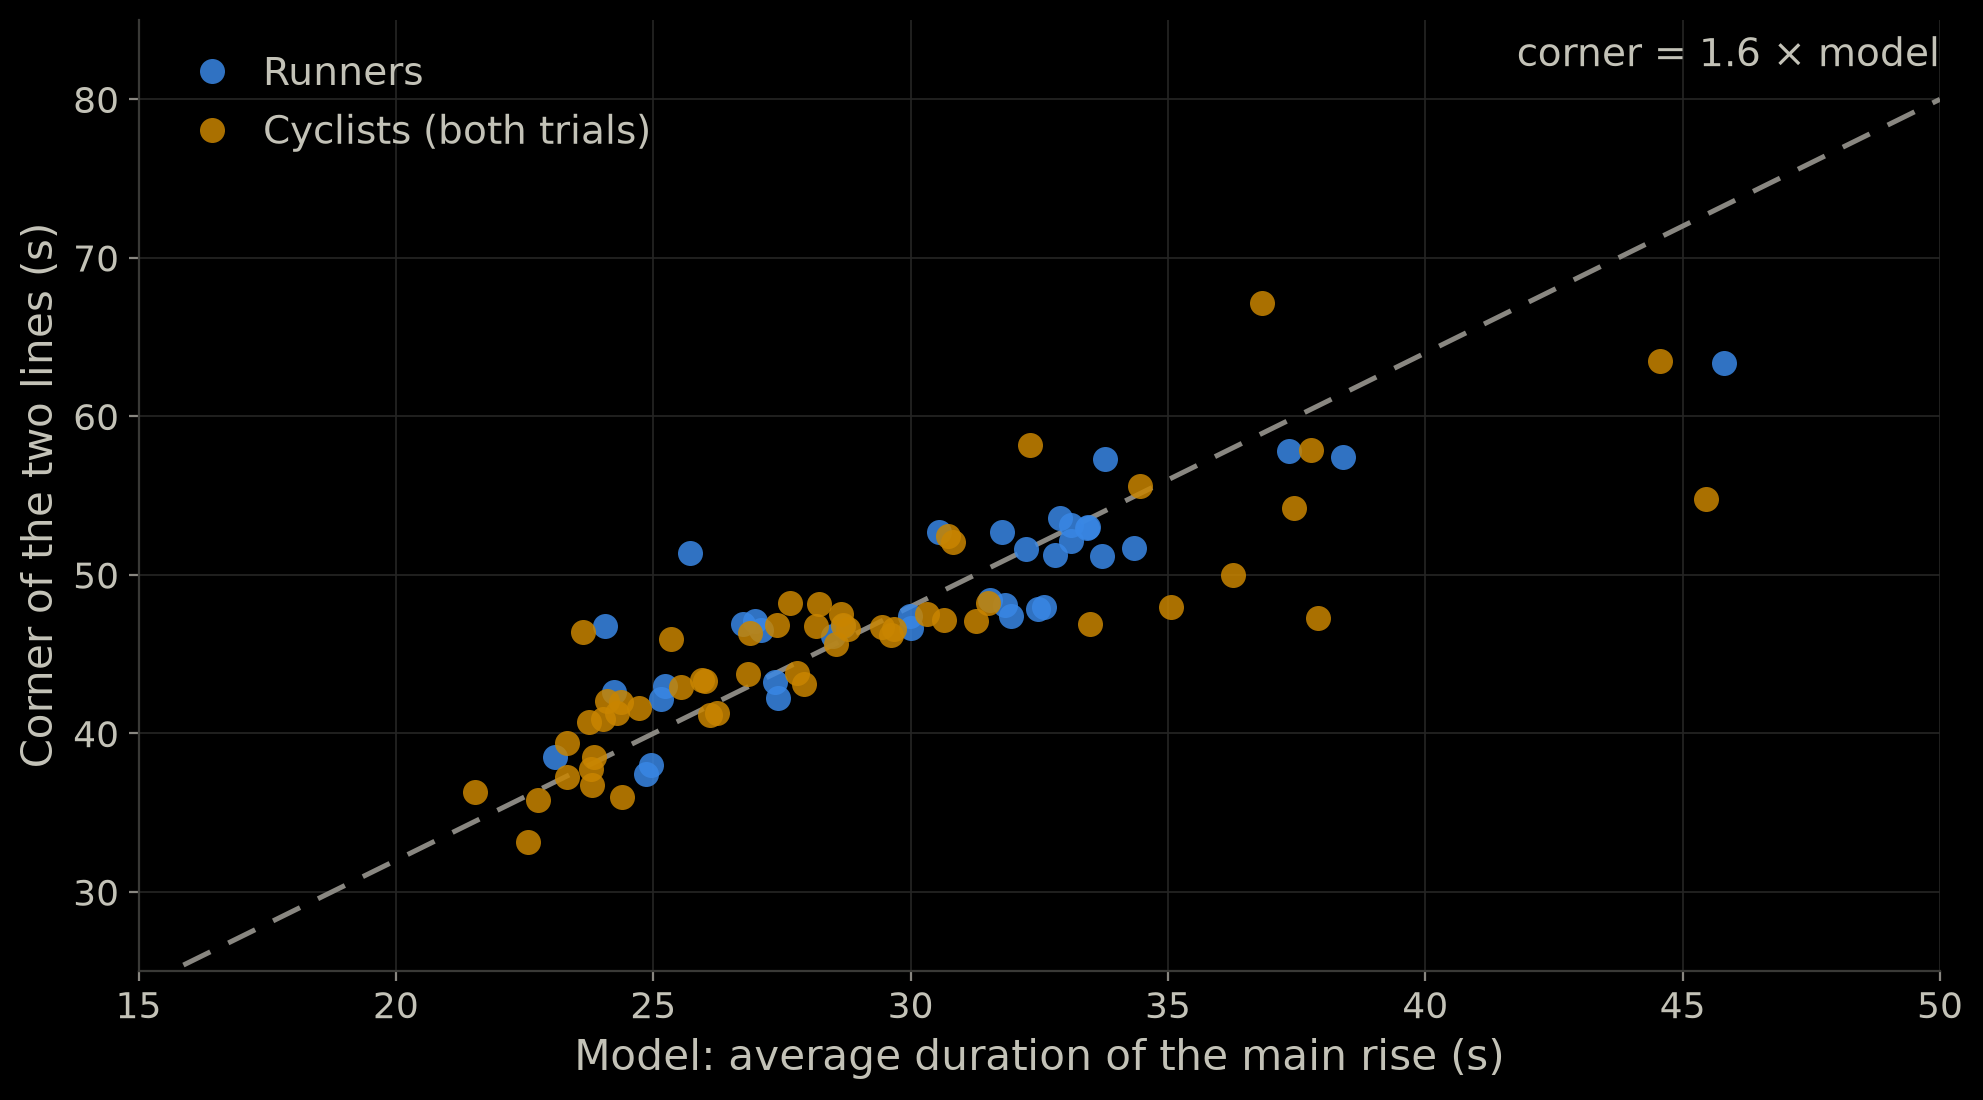
It follows the model.

Scatter plot: each person's corner against the model's average duration of the main rise, for runners and cyclists; the points follow a dashed line where the corner equals 1.6 times the model value

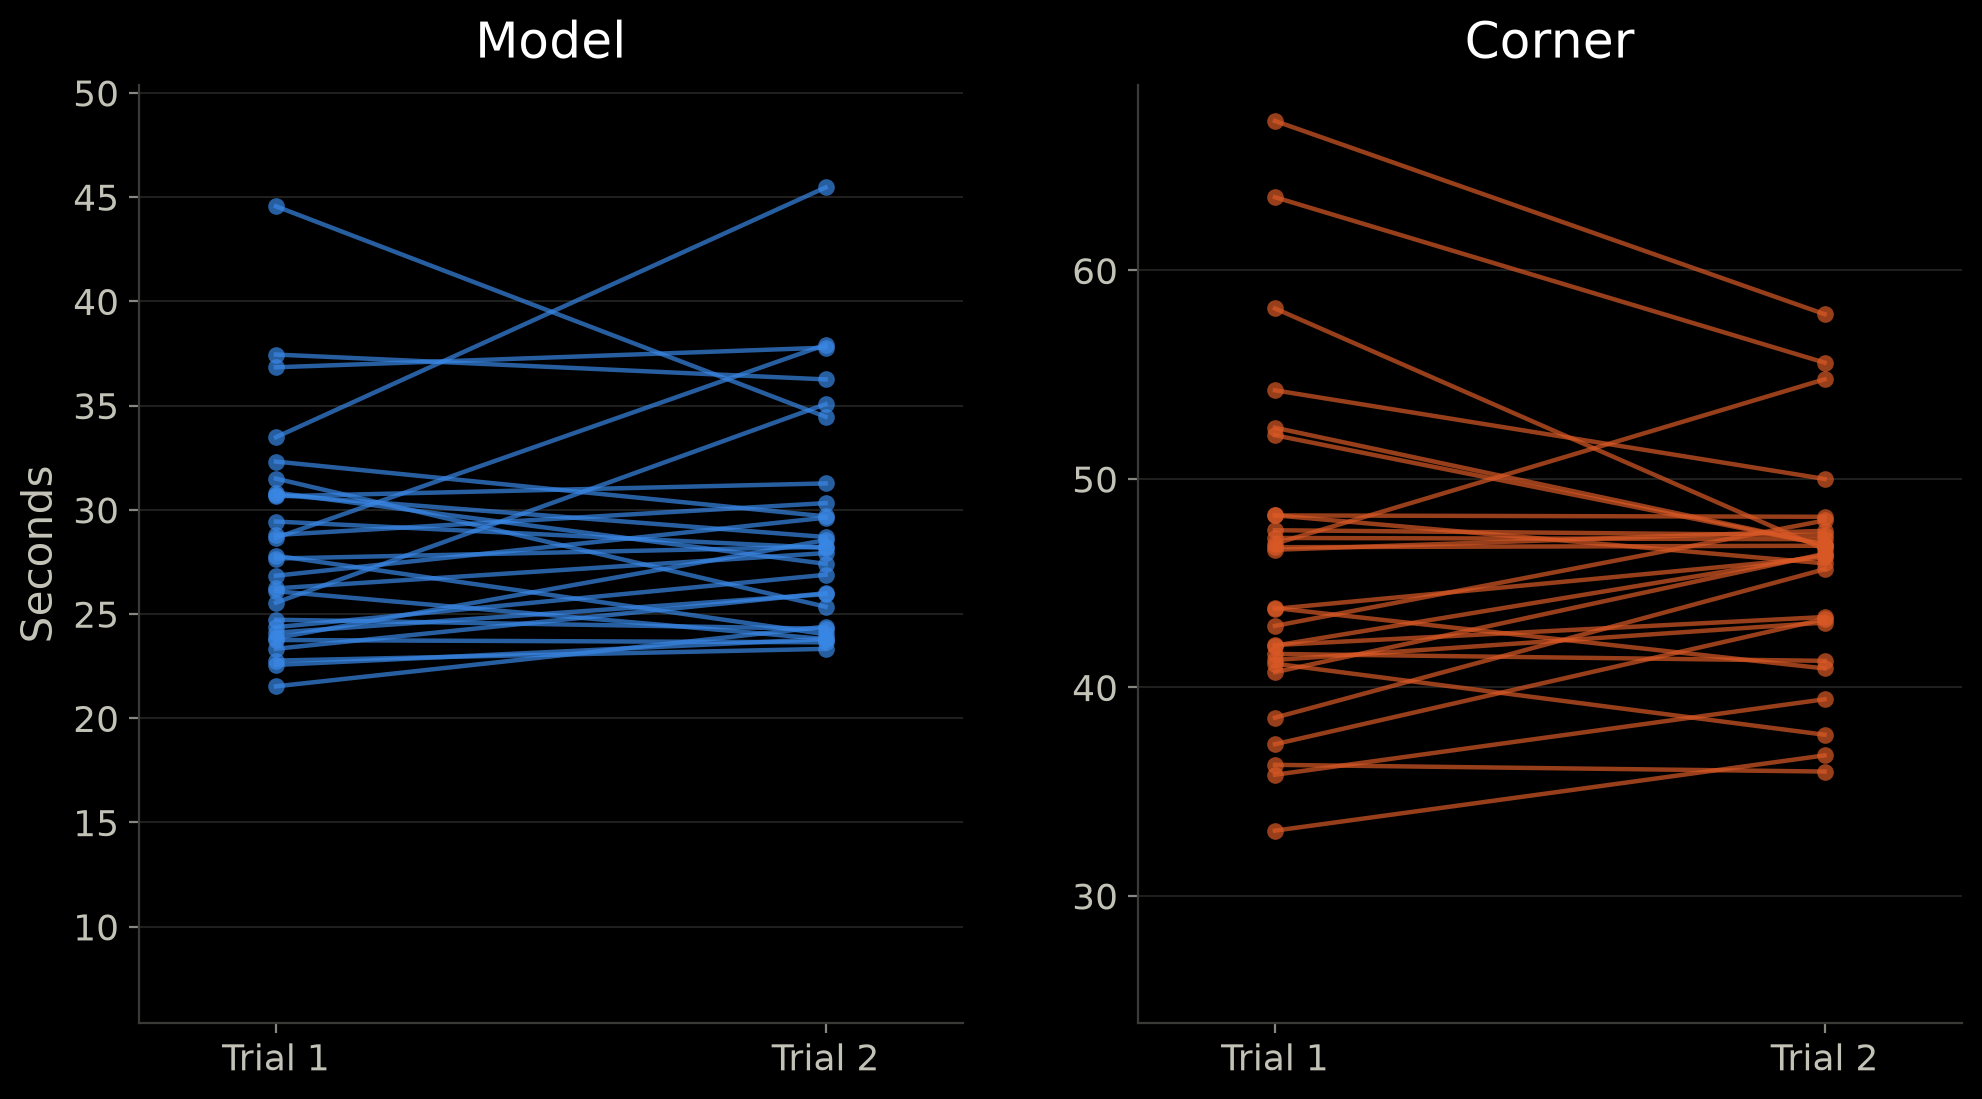
It repeats as well as the model.

Each cyclist's value in trial 1 joined to trial 2 by a line, for the model (left) and the corner (right); both panels span the same number of seconds and the lines are similarly flat

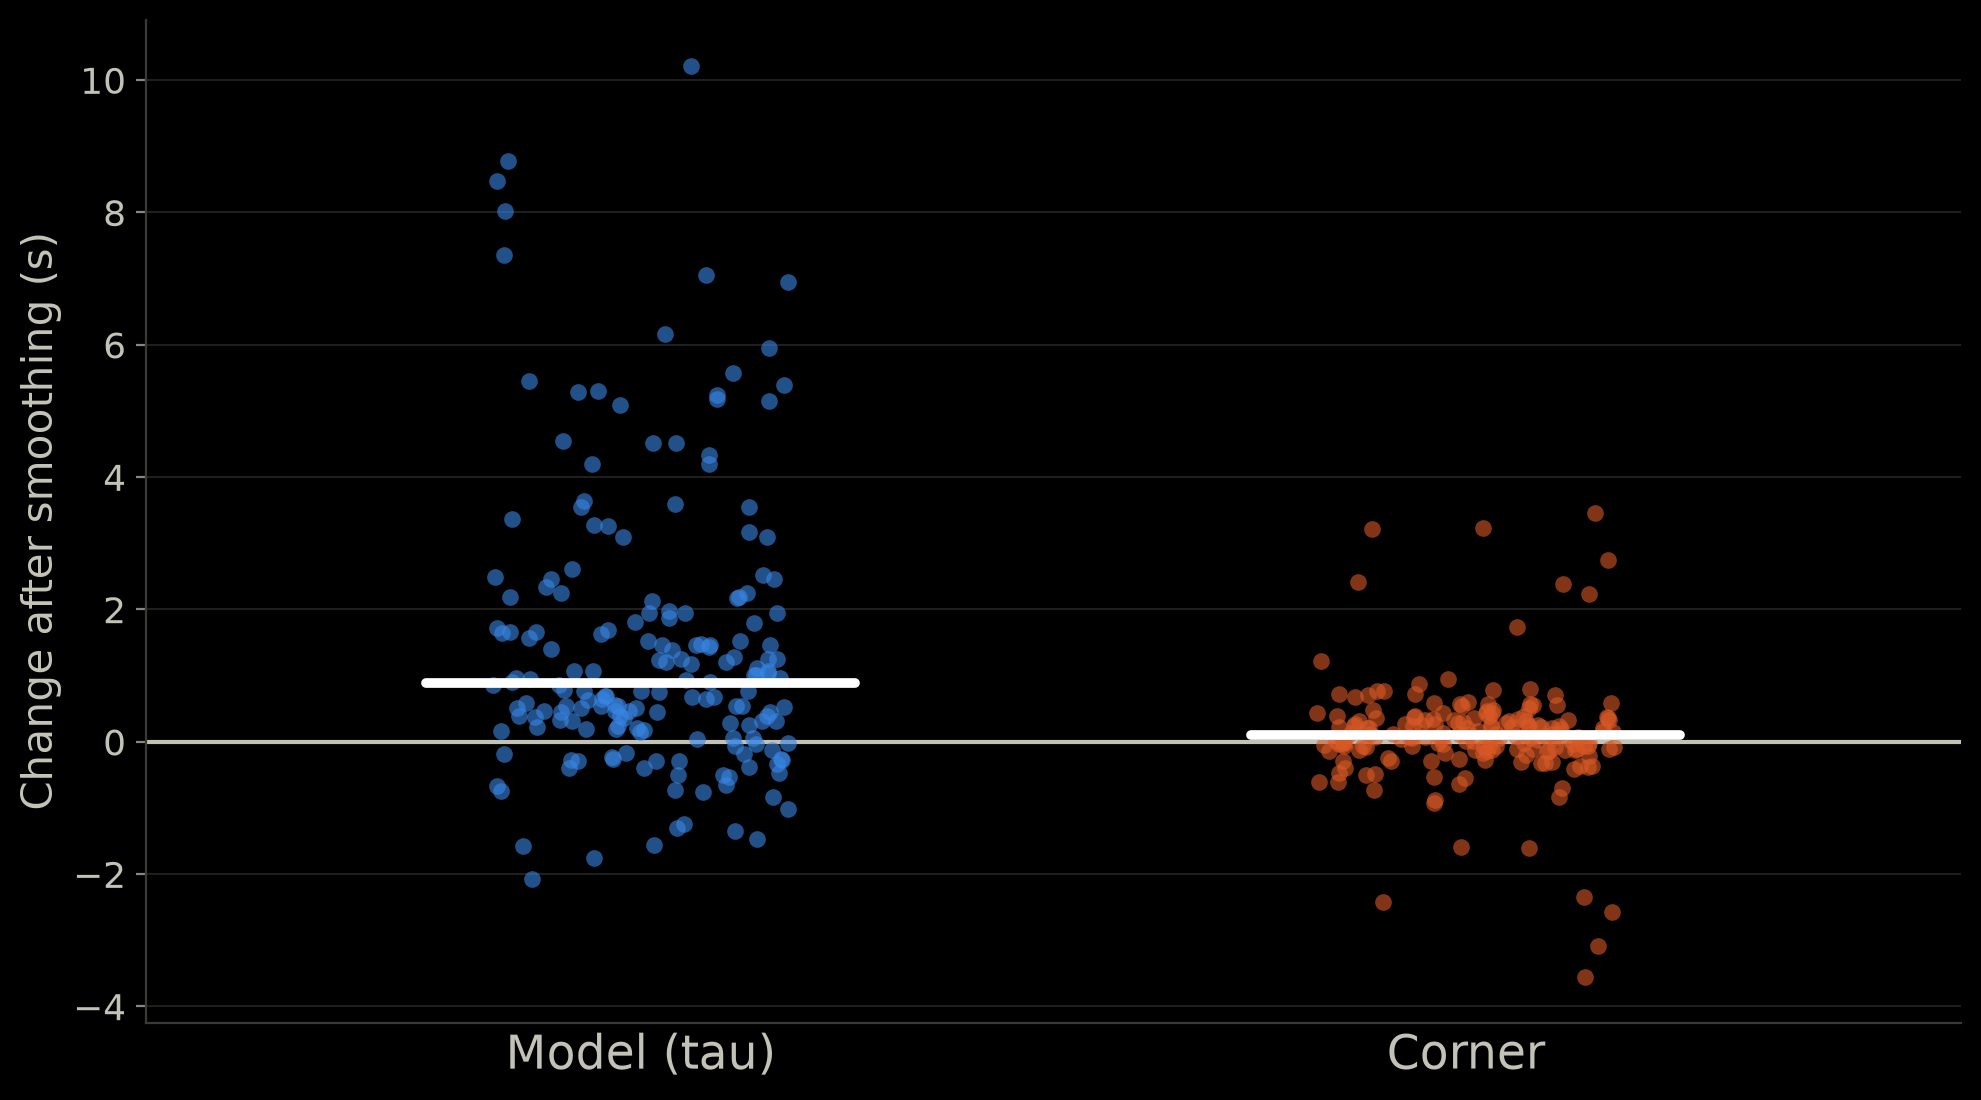
Smoothing the data barely moves it.

How much smoothing the data changes each result, in seconds: the model's tau shifts upward by about a second on average and up to 10 seconds, while the corner stays close to zero

A simple, robust, meaningful, and repeatable marker for VO₂ kinetics. Maybe.

The two-line fit with the corner circled

Simple

Smoothing moves the model's tau but leaves the corner near zero

Robust

Corner against the model's average rise duration, following the 1.6 line

Meaningful

Cyclists' trial 1 to trial 2 lines, model and corner similarly flat

Repeatable

As long as...

  • ...the effort is all-out
  • ...VO₂ rises at a typical speed
  • ...it's compared within the same kind of test
  • ...we were neither unlucky nor stupid

You had four minutes.

Inspiration

  • Whipp & Wasserman (1972) Oxygen uptake kinetics for various intensities of constant-load work. J Appl PhysiolWhere the slow component got its name
  • Whipp et al. (1982) Parameters of ventilatory and gas exchange dynamics during exercise. J Appl PhysiolThe three-phase picture
  • Barstow & Molé (1991) Linear and nonlinear characteristics of oxygen uptake kinetics during heavy exercise. J Appl PhysiolThe two-delay bi-exponential model we used
  • Özyener et al. (2001) Influence of exercise intensity on the on- and off-transient kinetics of pulmonary oxygen uptake in humans. J PhysiolHow the curve changes across intensity domains
  • Poole & Jones (2012) Oxygen uptake kinetics. Compr PhysiolThe review to start with
  • McNulty & Robergs (2017) New methods for processing and quantifying VO₂ kinetics to steady state: VO₂ onset kinetics. Front PhysiolA straight line fits the early rise at least as well as an exponential
  • Robergs et al. (2025) VO₂ linear-onset kinetics spanning steady- and non-steady-state exercise. Front PhysiolThe same idea, up to severe intensity
  • Spencer et al. (2012) Characterizing the profile of muscle deoxygenation during ramp incremental exercise in young men. Eur J Appl PhysiolTwo lines beat a smooth curve, in muscle oxygen data
  • Bernard et al. (2006) On the modeling of breath-by-breath oxygen uptake kinetics at the onset of high-intensity exercises. J Appl PhysiolThe bi-exponential answer depends on the fitting algorithm
  • Robergs, Dwyer & Astorino (2010) Recommendations for improved data processing from expired gas analysis indirect calorimetry. Sports MedWhere our smoothing filter setting comes from

Thanks to Yannick Sondermann for this incredibly fun opportunity.

Here is the result of our collaboration